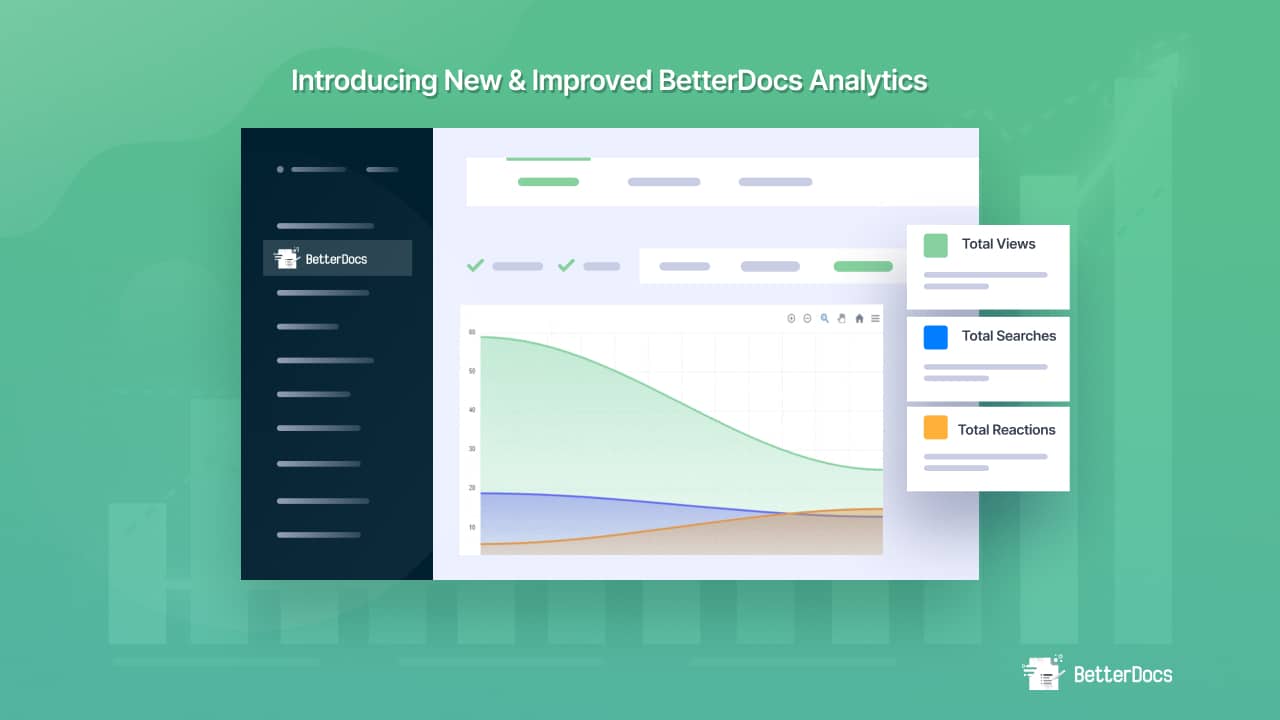
When it comes to helping you reduce your support tickets and enhance your customer support, being able to measure your knowledge base performance is absolutely essential. To help you do just that, we are thrilled to announce that BetterDocs v.2.1.0, our latest release, comes with a completely revamped, new and improved BetterDocs analytics tool to make your knowledge base management more effective than ever before!
Experience Faster Performance With The Improved BetterDocs Analytics Tool
BetterDocs already comes with a built-in feature to track and analyze the performance of each of your knowledge bases. And we understand that the built-in, advanced BetterDocs analytics tool makes this knowledge base plugin stand out from all others in the industry. Therefore, with each update of the plugin, we have always aimed to bring you all the necessary improvements needed to elevate your user experience more than ever before. And so with the latest release of BetterDocs v.2.1.0, we wanted to take this exclusive feature a notch higher.
Bringing you a new and improved BetterDocs analytics tool that comes with a completely rebuilt, redesigned, and revamped user interface. Not just that, we have also switched to ReactJS to ensure each one of our 30K+ active users can experience improved performance and faster loading times. Now, you can collect and analyze all metrics to understand the performance of your knowledge base system with ease.
Deep Dive Into The New, Revamped BetterDocs Analytics Tool
Ready to explore what’s new with the built-in, improved Analytics tool from BetterDocs v.2.1.0? Then dive in and take a look at all the new updates and improvements below.
A Completely New And Improved User Interface
To make it easier for you to see all of your knowledge base performance and analytics data, all from one place, we have introduced a brand new, revamped and improved user interface for the built-in Analytics tool with BetterDocs v2.1.0.
Now, you can easily see several important key metrics such as the total number of reactions on your knowledge base, which will help you understand how helpful your documentation articles are for your site visitors. You can also see the total number of views as well as the total number of search queries performed by site visitors.
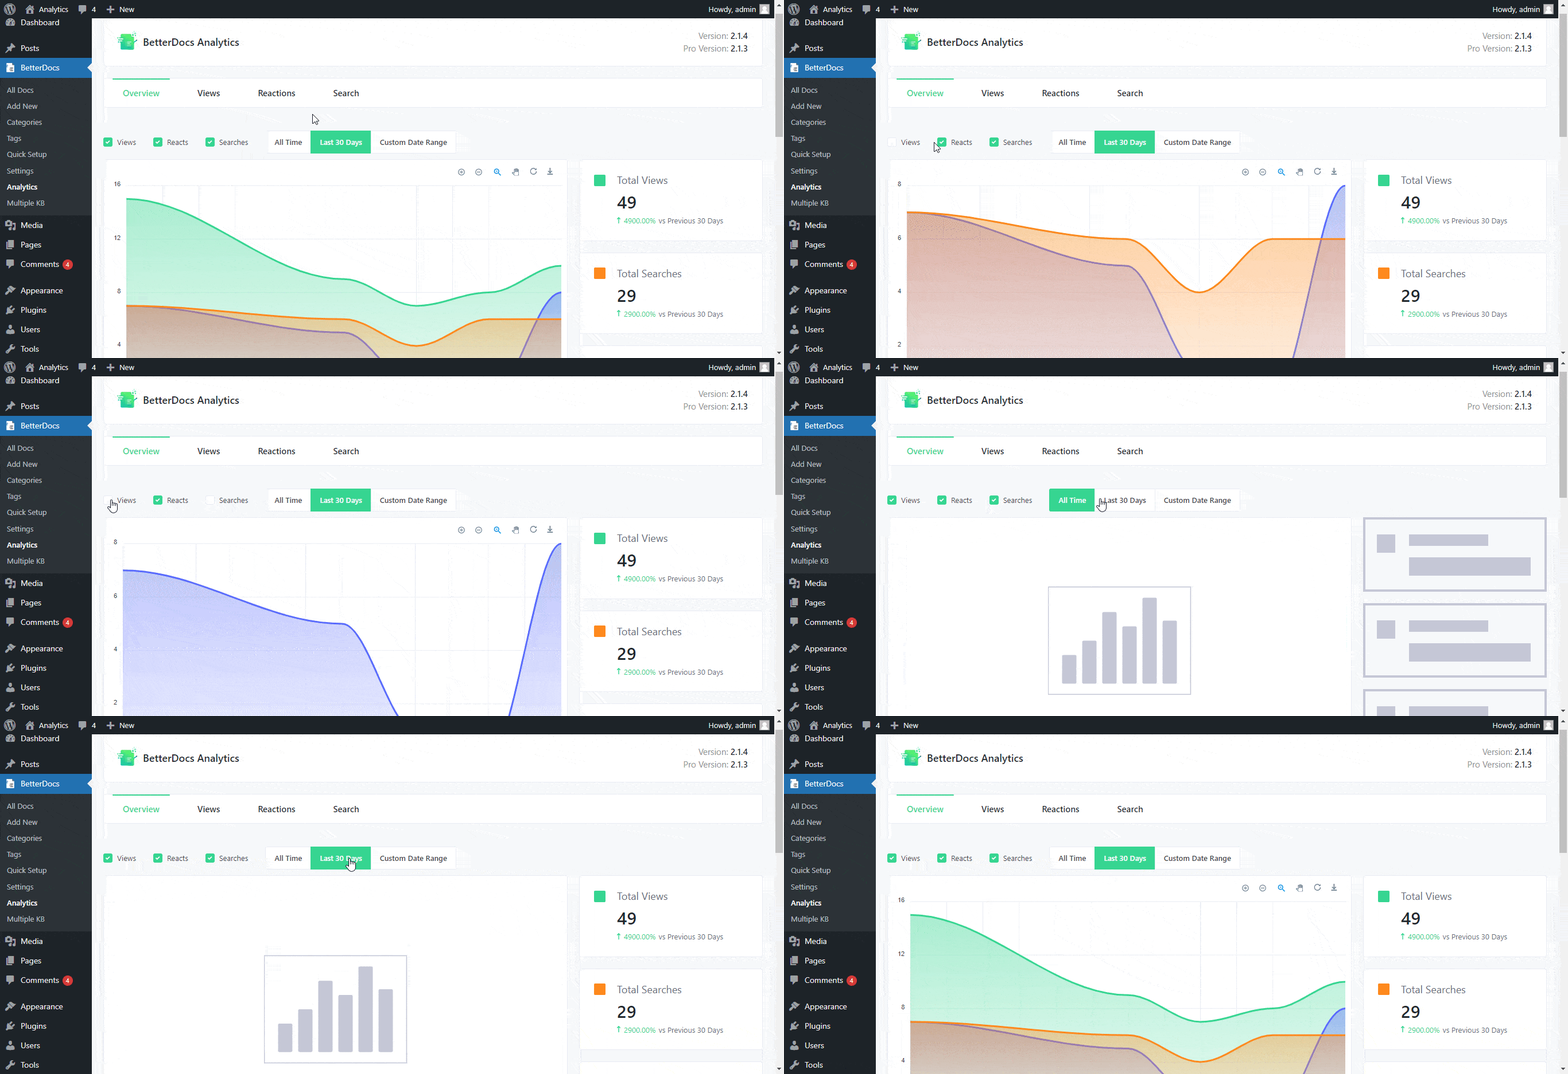
These metrics can give you an overall understanding of how your knowledge base is performing at any given time.
View Leading, Top Performing Documentation
In addition to this, with the new BetterDocs Analytics tool, you can now easily see your top performing documentation articles. From the Analytics dashboard, you can see the category of your top performing documentation under the ‘Leading Docs’ tab, and even see the number of views, and reactions for those documentation articles.

That’s not all, you can also switch to the ‘Leading Category’ tab to see which categories of your knowledge base are performing best. These insights can help you understand what kind of information your customers or site visitors are most interested in.

Check Your Reactions From Customers Or Users Effortlessly
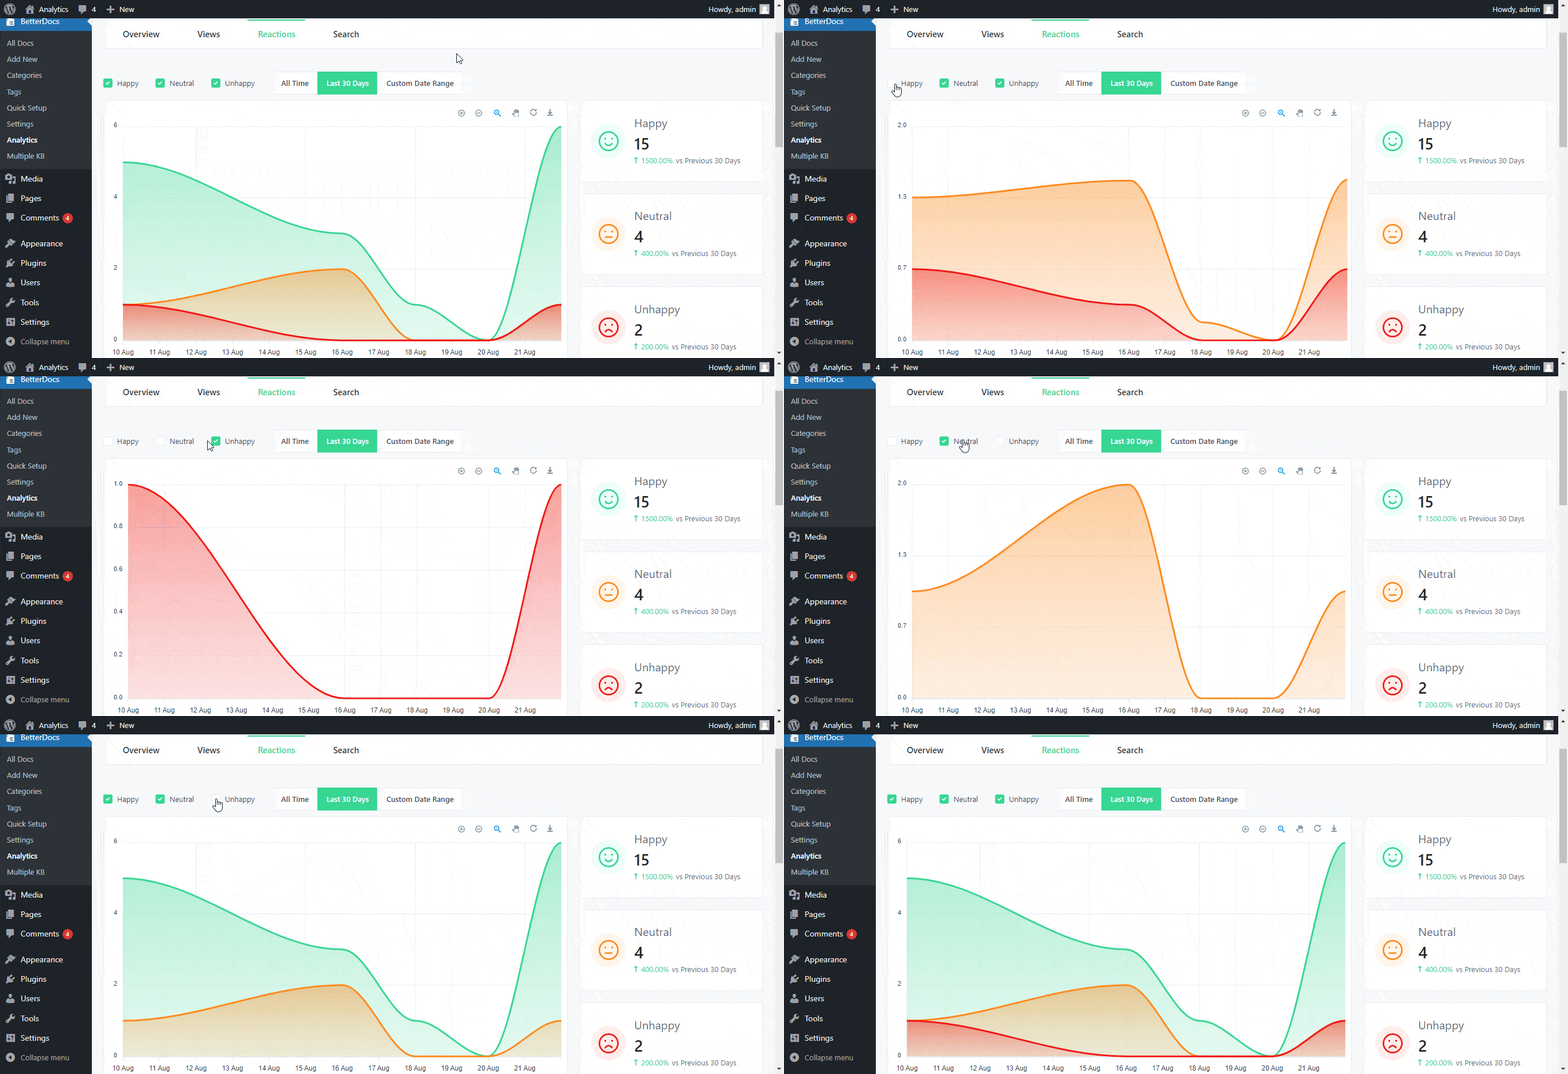
From your BetterDocs Analytics dashboard, you can easily view detailed analysis of the reactions on your knowledge base articles. These reactions will help you understand just how useful your articles are for site visitors or your target audience.
After navigating to BetterDocs→ Analytics, simply click on the ‘Reactions’ tab. Here, you can view data regarding the different reactions of your readers for your knowledge base articles. You can easily filter these data by clicking on the reaction metrics at the top bar, such as ‘Happy’, ‘Neutral’, and ‘Unhappy’ as shown below.
Analyze The Total Views And Unique Views
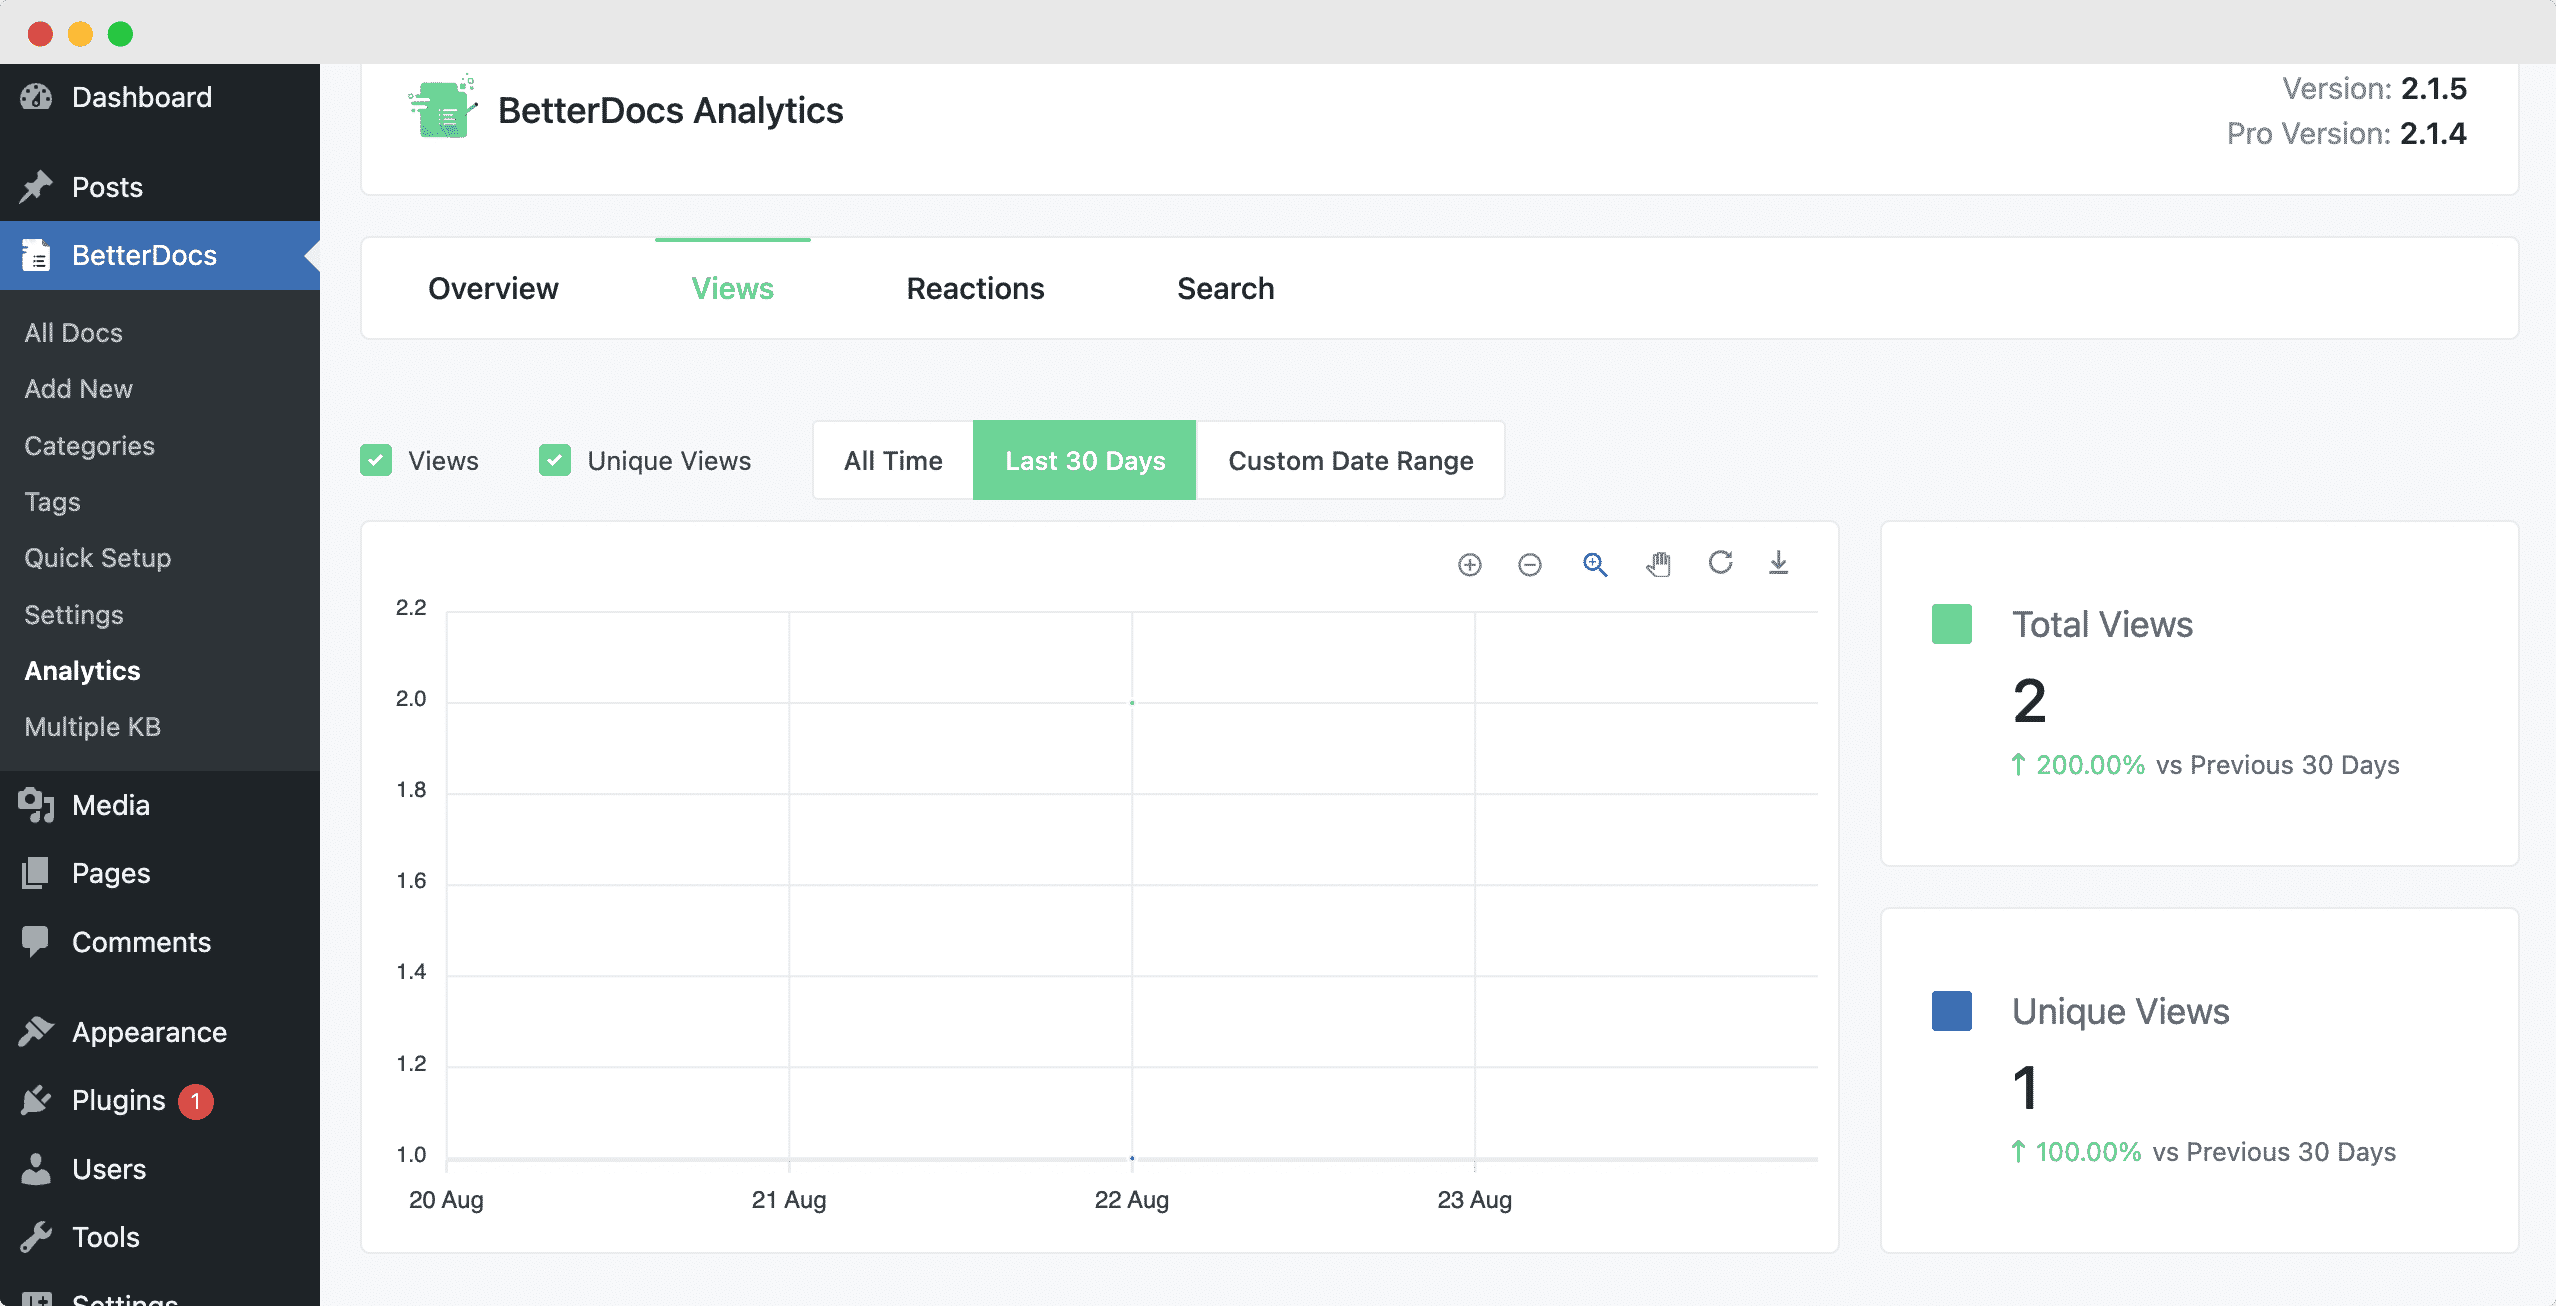
Moreover, you can also head over to the ‘Views’ tab to see what your total views and unique views are for your documentation articles. Unique views tells how many site visitors have landed on your documentation page for the very first time, while total views tell you the total number of times your documentation has been viewed by site visitors for any given period of time.
Identify Most Popular Search Terms By Site Visitors
To improve your customer support and ensuring your self-service system is most effective, it is important to know the search terms that site visitors will use when searching your knowledge base.
With the advanced Analytics tool introduced with BetterDocs v.2.1.0, you can now easily identify the most popular keywords or “search terms” that site visitors use to browse and look for helpful articles on your knowledge base.
Simply click on the ‘Search’ tab from BetterDocs Analytics dashboard, and you will be able to see key information such as the total number of search queries, the number of search terms for which valid results have been found and more.
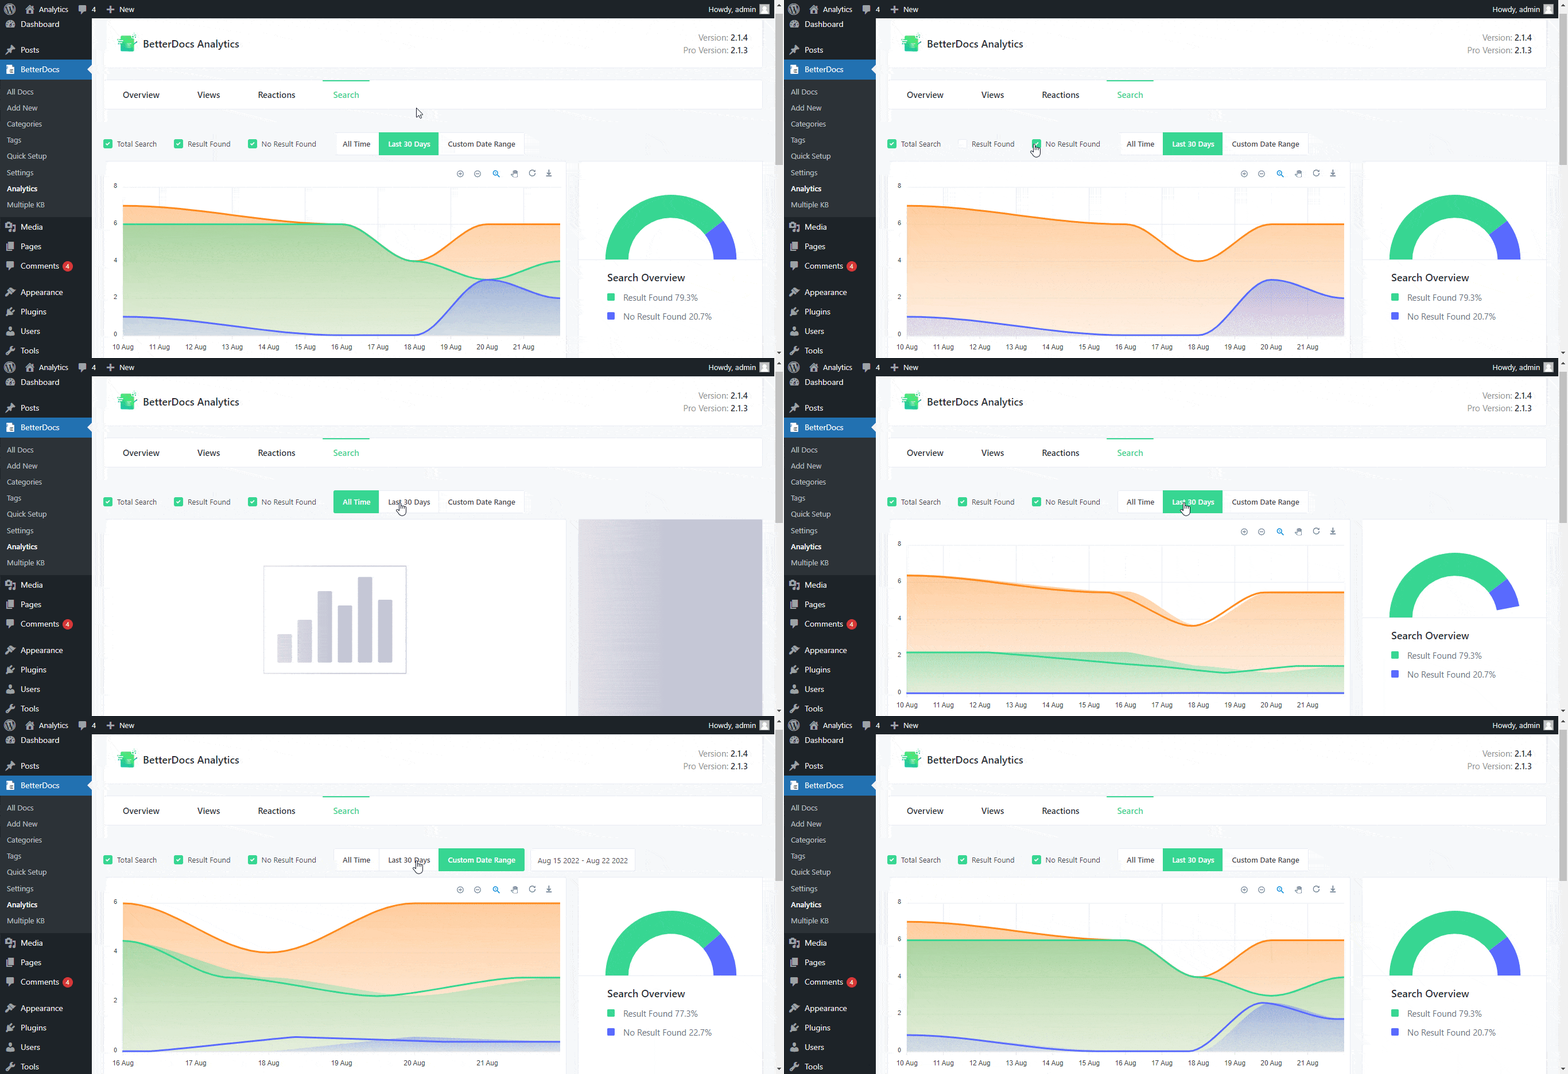
Moreover, you can even see if there are any search terms for which no documentation articles are available.

Compare Performance Of Multiple Knowledge Bases
If you have created multiple knowledge bases in WordPress, then you can easily measure and compare how each of these knowledge bases are performing with the improved Analytics tool from BetterDocs v2.1.0.
You can check the total number of views and reactions for each different knowledge bases, and thus determine which one is performing better than the other by going into the ‘Leading Knowledge Base’ tab.

Tutorial: How To Evaluate Knowledge Base Performance With BetterDocs Analytics?
Here, we are going to give you a step-by-step walkthrough to show how BetterDocs Analytics can help you create more effective, content-rich knowledge base articles and scale your support tickets effortlessly.
Note: As this is a premium feature, please make sure that you have the free version of BetterDocs, as well as BetterDocs PRO installed and activated on your website.
Watch The Video Tutorial
Step 1: Configure BetterDocs Analytics Feature
If you already have documentation articles published on your website, then after installing BetterDocs and BetterDocs PRO, you can use the built-in Analytics tool to measure the performance of your knowledge base.
To do this, simply navigate to BetterDocs→ Analytics from your WordPress dashboard. From here, you can click on the ‘Overview’ tab to get an overall view of your knowledge base performance and analysis, as shown below.

Step 2: Select The Time Period For Analytics Report
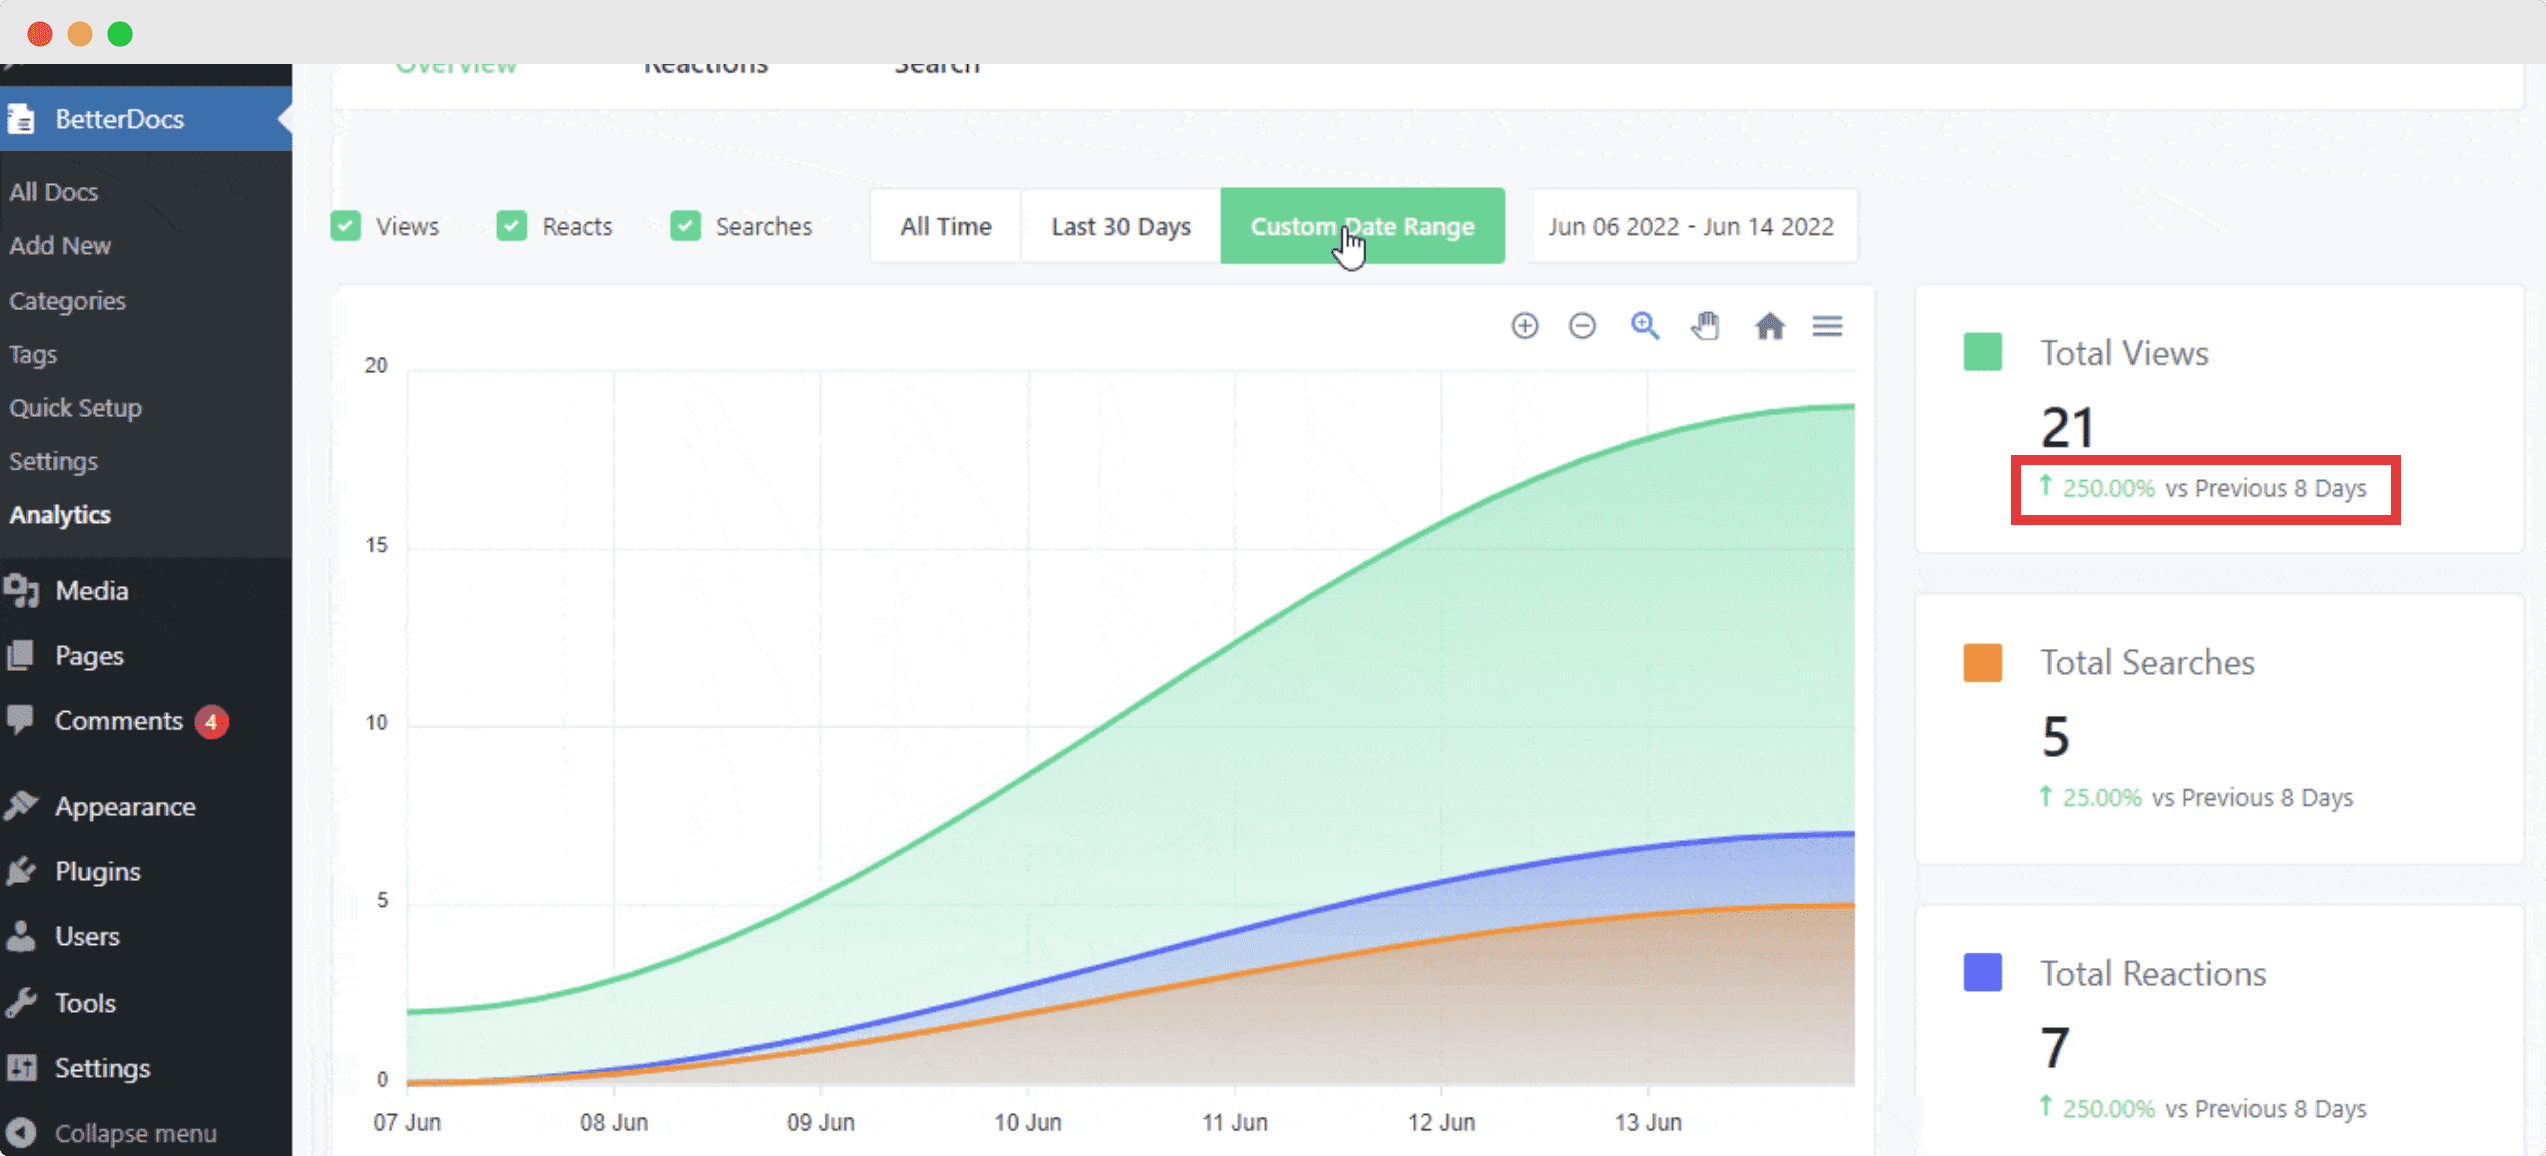
Next, you can see how your documentation articles are performing at any given time period by using the filters at the top of your BetterDocs Analytics dashboard. You can check the performance of all time, the previous 30 days, or select any specific time period by clicking on the ‘Custom Date Range’ filter as shown below.

Step 3: View & Measure Knowledge Base Performance
Once you have entered the date range, you can easily measure your knowledge base performance by checking different key metrics.
You can click on the metrics such as ‘Views’, ‘Reacts’ and ‘Searches’ and see the different graphs for each of these metrics to know how a knowledge base is performing in every case. Furthermore, you can check the percentage of growth and decline for that given time period for each of these key metrics.
How To Compare & Measure Performance Of Multiple Knowledge Bases?
Just as we mentioned earlier, with the improved Analytics tool from BetterDocs v2.1.0, you can easily compare and measure the performances of multiple knowledge bases on your WordPress website. Let’s take a look at how this works.
Step 1: Create Multiple Knowledge Bases With BetterDocs
First, you need to set up multiple knowledge bases on your WordPress website. If you have not done this before, then you can easily do so by following this detailed guide on creating multiple knowledge bases.
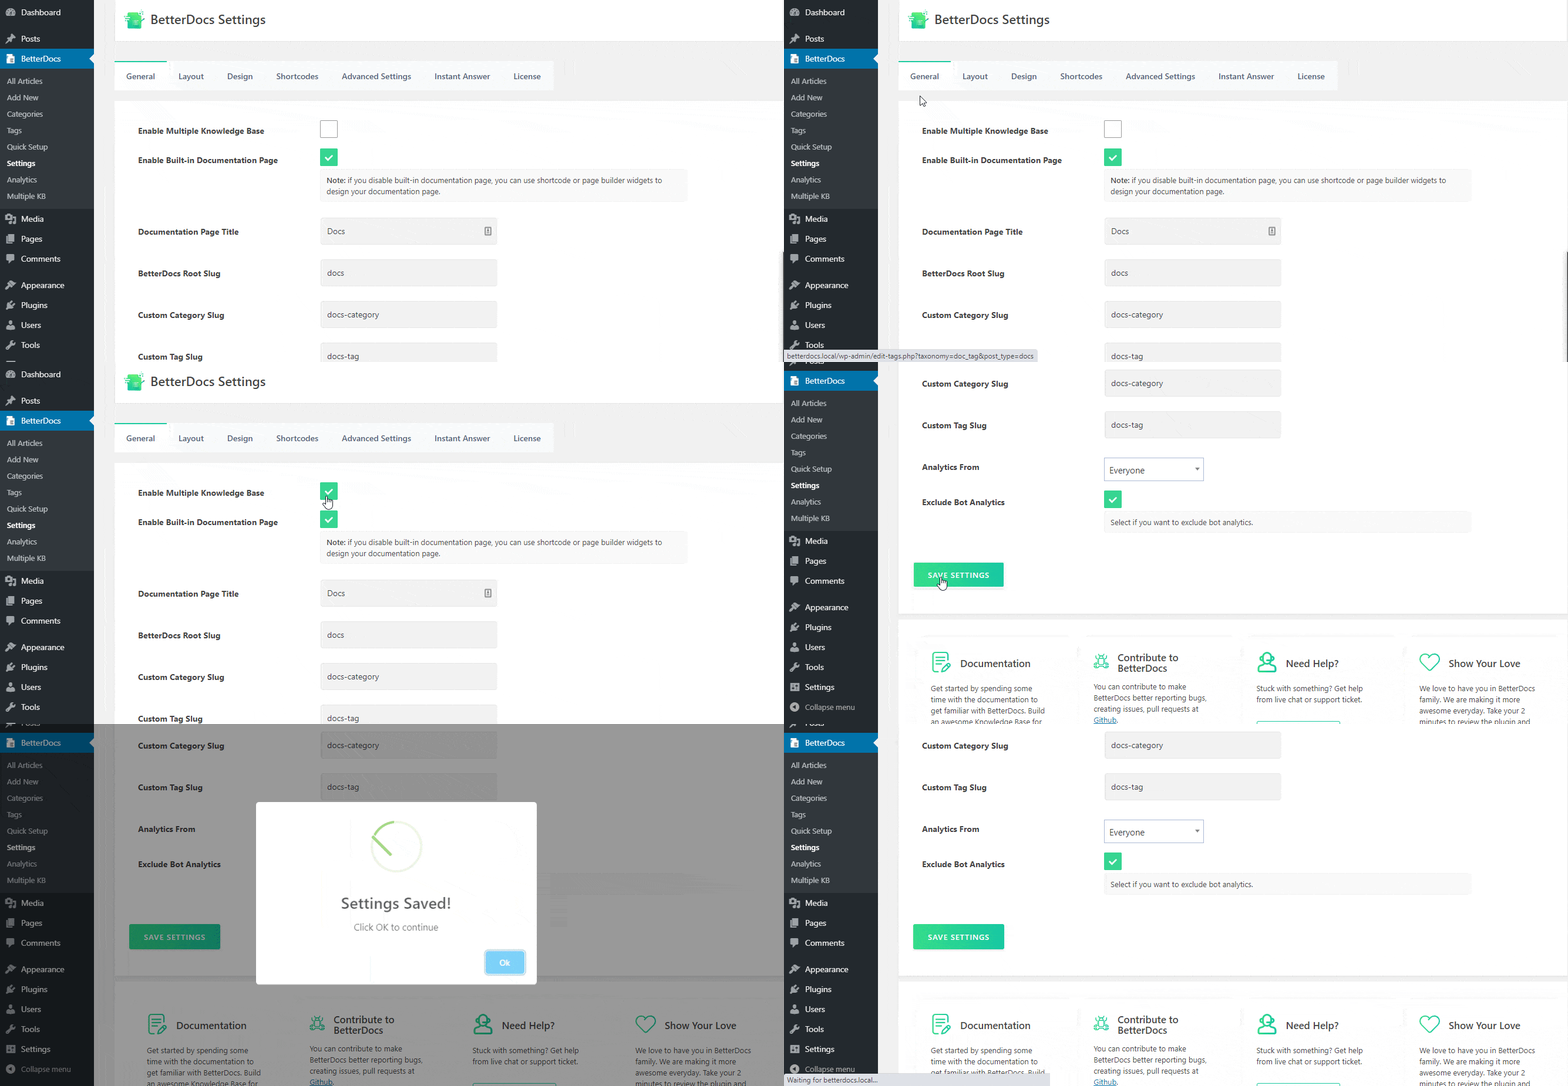
Moreover, if your website is created using Elementor, then you can easily set up multiple knowledge bases with Elementor and BetterDocs as well.

Step 2: View The Performance Of Your Leading Knowledge Bases
Once you have set up multiple knowledge bases in WordPress, simply head over to BetterDocs→ Analytics as shown in the steps above. Then, scroll down until you see the ‘Leading Knowledge Base’ tab. From here, you can check and see the performances of different knowledge bases at a glance.

This way, BetterDocs Analytics give you full flexibility and freedom to analyze every aspect of your knowledge base performance.
Enhance The Performance Of Your Knowledge Base With BetterDocs Analytics

Get started with BetterDocs v.2.1.0 today or update to the latest version to get your hands on this advanced, exclusive features including BetterDocs analytics tool and use it to enhance every aspect of your website’s knowledge base and effortlessly skyrocket your conversions.
If you have any queries about BetterDocs, feel free to reach out to our support team or comment below to let us know what you think of this new feature. We will be delighted to get feedback from you. For more updates, or tips and tricks, don’t forget to subscribe to our blog and join our friendly Facebook community.


