- Step 1: Navigate To BetterDocs Analytics
- Step 2: Select The Analytics Overview Tab
- Step 3: View Reaction Analytics Of Your Documentation
- Step 4: Analyze Total Views & Unique Views Of Your Documentation
- Step 5: View Search Analytics Of The Documentation
- Step 6: View Individual Analytics Of The Documentation
- How To Use BetterDocs Analytics With Multiple Knowledge Bases?
BetterDocs PRO allows you to keep track of how your knowledge base is performing. With its ‘Analytics’ feature, you can easily check how many users have viewed, reacted, and even see which search terms have been used the most for your documentation. It comes with an excellent graphical interface that lets you check the feedback you have received in a statistical format.
Note: To use this ‘Analytics’ feature, you need to have the BetterDocs Pro version installed & activated on your WordPress dashboard.
Step 1: Navigate To BetterDocs Analytics #
To explore all the settings of BetterDocs ‘Analytics,’ navigate to ‘BetterDocs→Analytics’ from the WordPress dashboard. After clicking on the ‘Analytics’ tab, you will get all the available options to track the performance of your documentation properly.

Step 2: Select The Analytics Overview Tab #
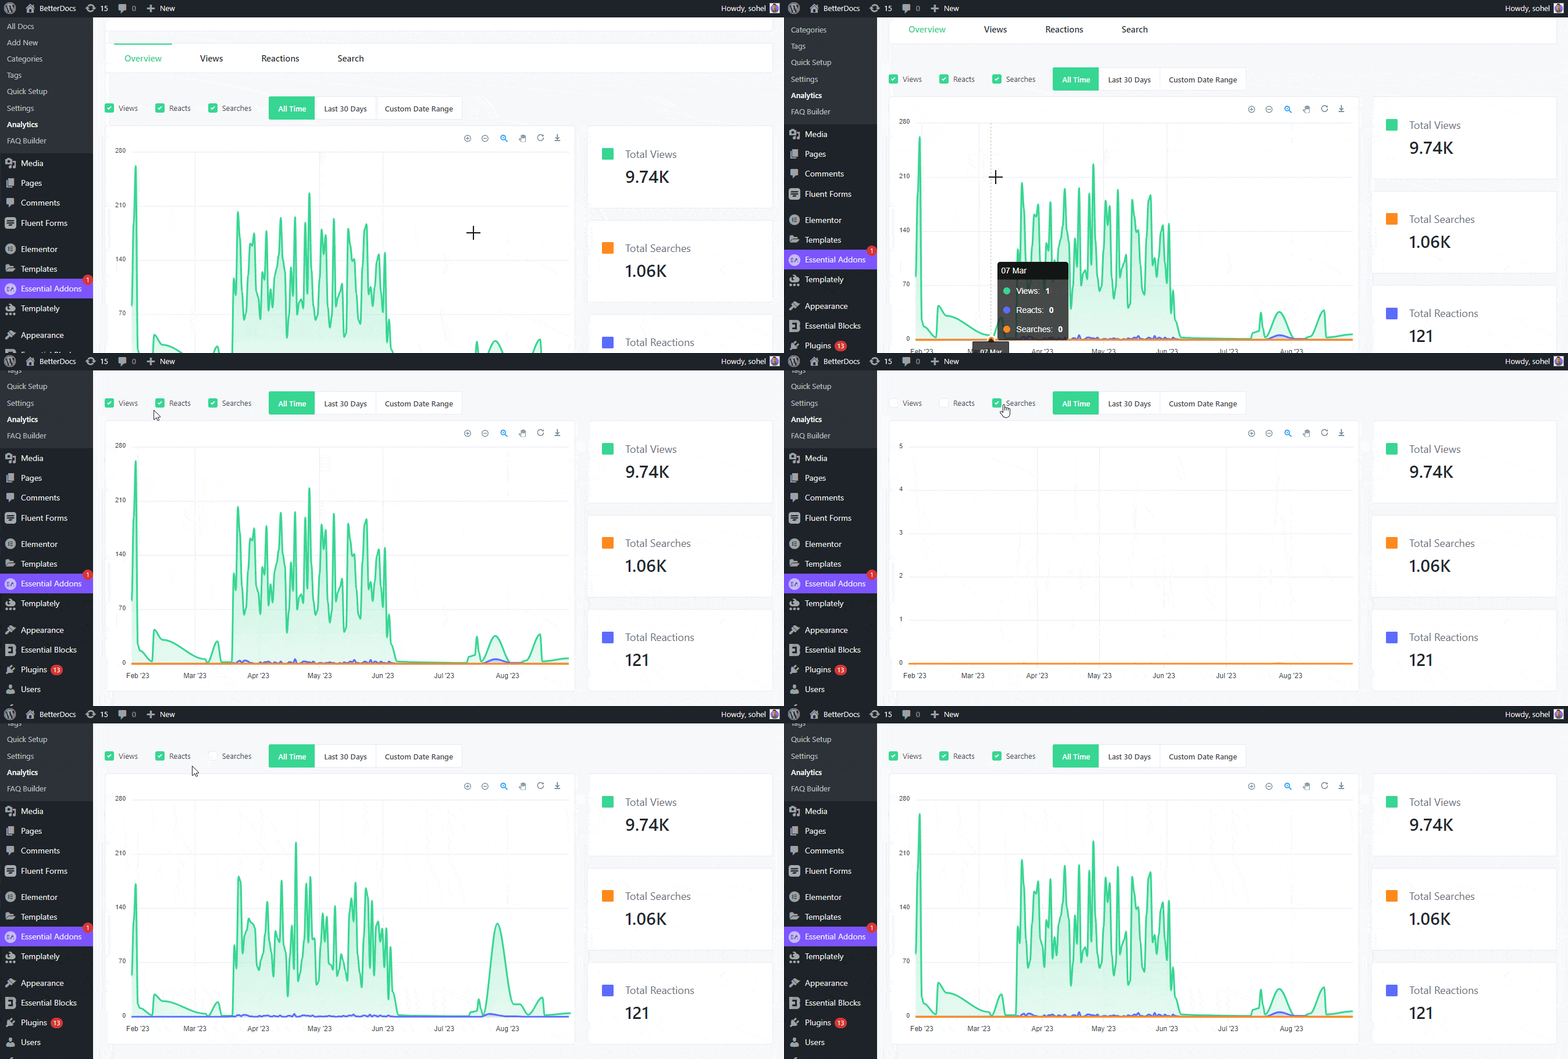
To get the overall performance of your documentation, first, head over to the ‘Overview’ tab. Then, you will get the accumulated performance of your BetterDocs documentation. You can filter your data on the basis of ‘Views’, ‘React‘,’ & ‘Searches’.

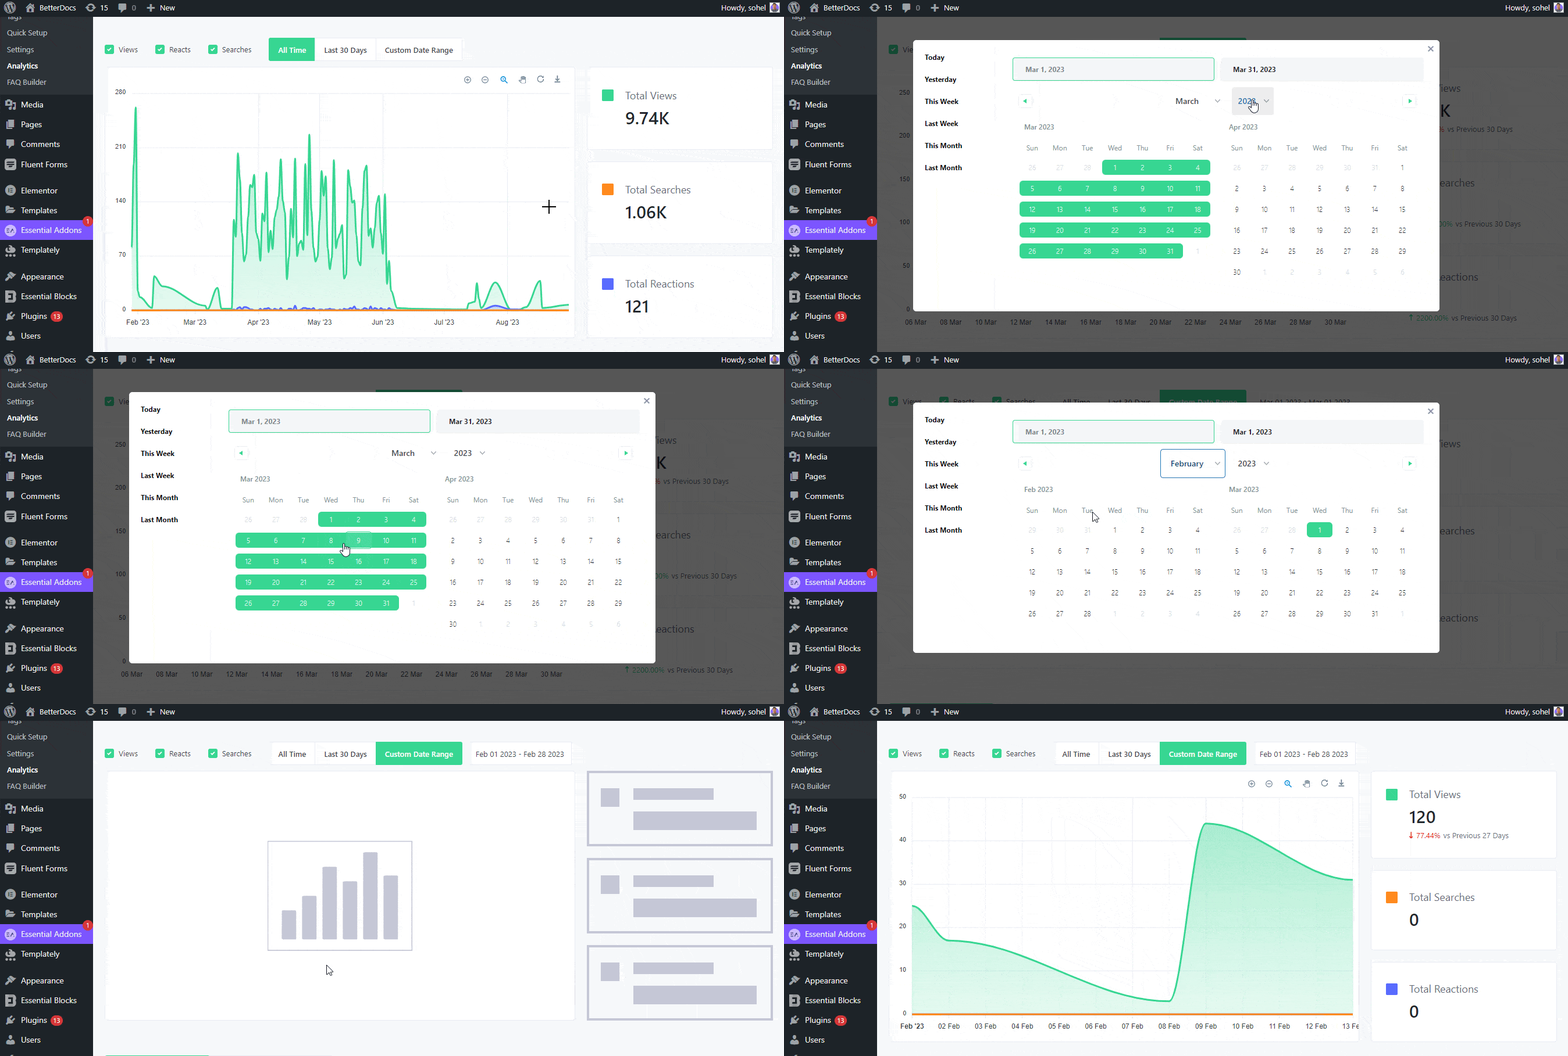
You can also track your performance based on your customized time. You can choose your timeline between ‘All Time’ and ‘Last 30 Days’, or you can insert your ‘Custom Date Range’ to get a clearer picture.

You can also check the list of your well-performed list of ‘Leading Docs.’ All your documentation will be properly categorized.

Also, if you want to explore the most popular categories of your site, just simply navigate to the ‘Leading Category’ tab, and you will see the rankings.

Step 3: View Reaction Analytics Of Your Documentation #
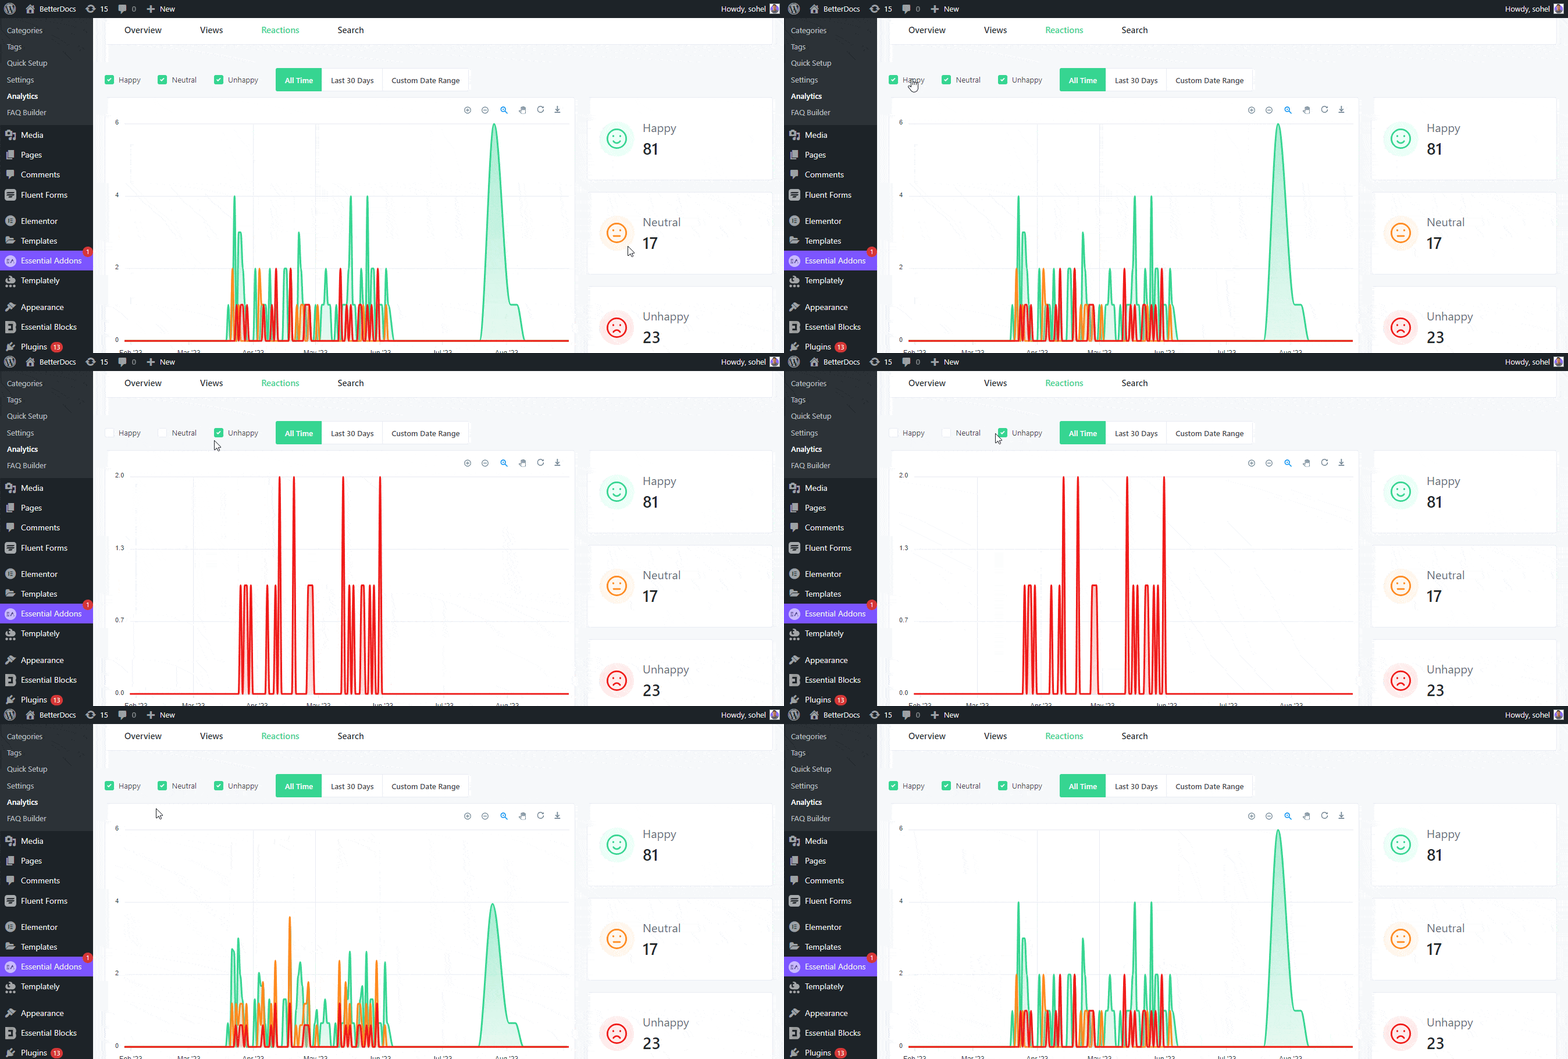
If you want detailed information about your customer interactions, head over to the ‘Reactions’ tab. Then, you will get the graph representation of your BetterDocs documentation. You can filter your data based on ‘Happy’, ‘Neutral’ & ‘Unhappy’.

If you scroll down, you will see which documents have aided your customer the most. They will be on the ‘Most Helpful’ tab. This field also shows the exact number of reactions from your readers.

And the least popular docs will be under the ‘Least Helpful’ tab. This section will help you improve your website content.

Step 4: Analyze Total Views & Unique Views Of Your Documentation #
Next, you can head over to the ‘Views’ tab to see how many people have viewed your documentation articles. You can easily check your ‘Total Views’ and ‘Unique Views’ from here, as shown below.

Step 5: View Search Analytics Of The Documentation #
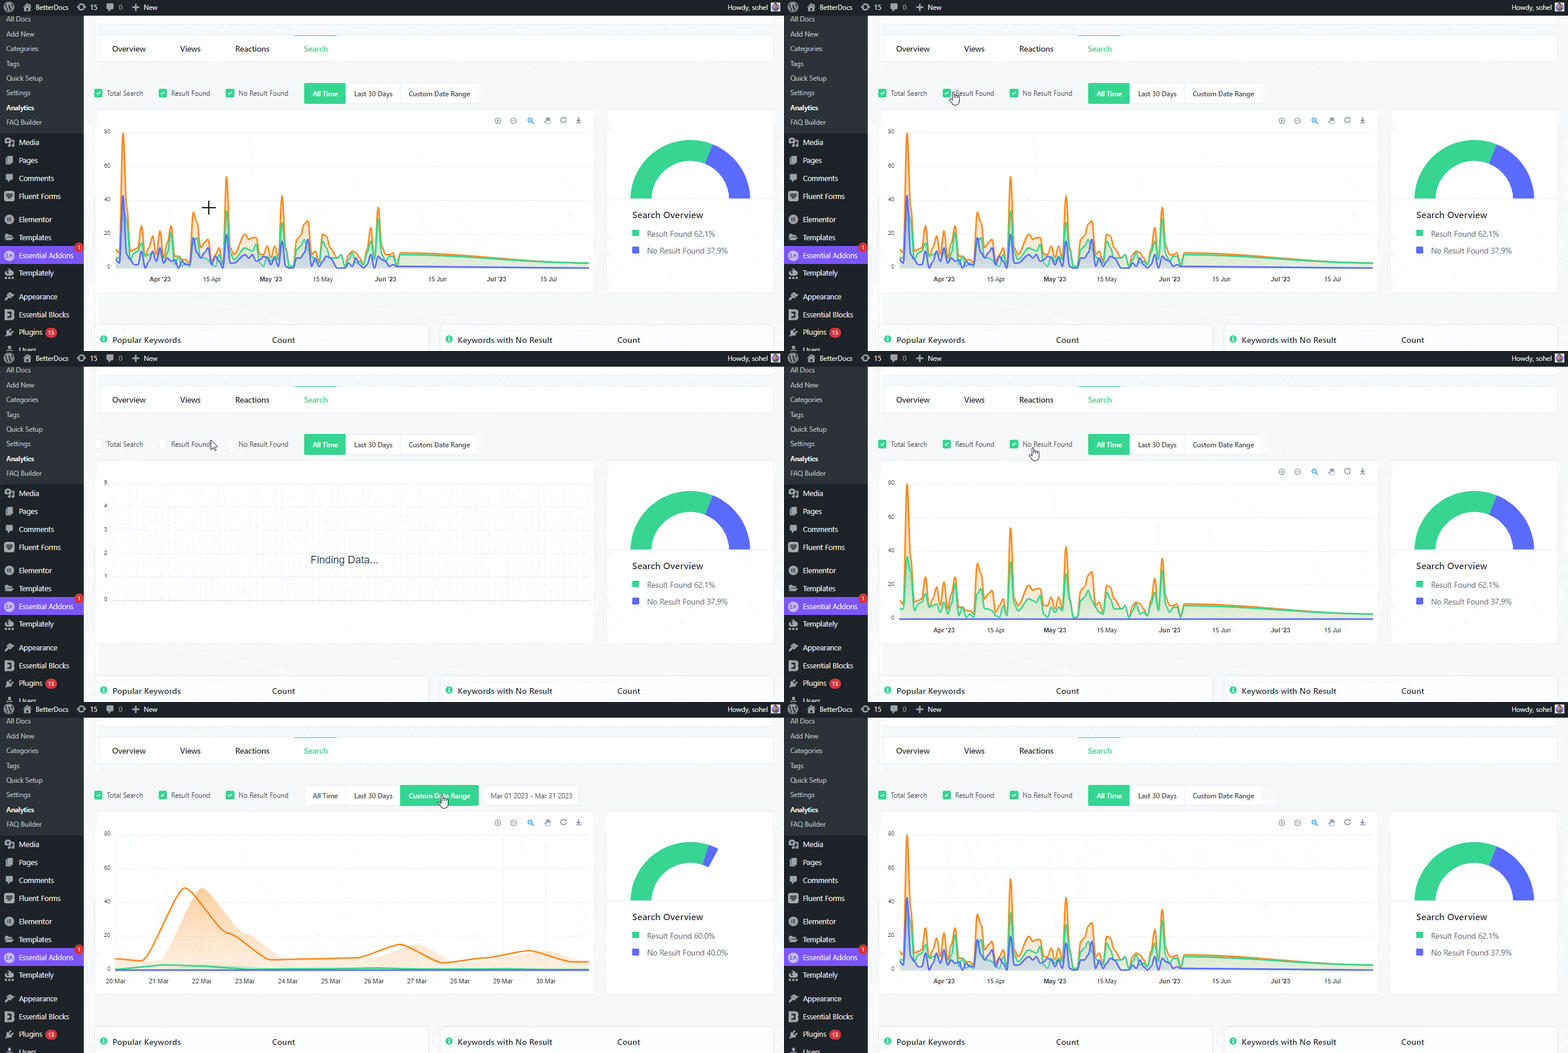
To get information on search volumes of your documentation, first head over to the ‘Search’ tab. Then, you will get an analysis of your BetterDocs documentation. You can filter your data based on ‘Total Search,’ ‘Results Found,’ & ‘No Results Found.’ On the right panel, you can see the ‘Search Overview’ percentage.

If you scroll down your website, you will see two separate sections named ‘Popular Keywords’ & ‘Keywords With No Result’. On the ‘Popular Keywords’ field, you will see which keywords are searched the most in the documentation & the ‘Keywords With No Result’ field will show the null searches for which no docs turn out for the reader.

Step 6: View Individual Analytics Of The Documentation #
By scrolling down to the ‘Leading Docs’ section from the Analytics Overview tab, you can easily check the Individual Analytics for any of the documentation articles by clicking on the analytics icon, as shown below.

How To Use BetterDocs Analytics With Multiple Knowledge Bases? #
BetterDocs Pro allows you to manage multiple knowledge bases on your WordPress. You can easily enable the option by simply navigating to BetterDocs→Multiple KB. It will assist you in maintaining separate web documentation for different products with complete customization capabilities. With BetterDocs analytics, you can measure the performance of your different knowledge bases.
Under the ‘Overview’ section, you can also compare and see which Knowledge Base is performing better if your website is running on multiple knowledge bases. This particular field shows the total ‘Views’ & ‘Reaction’ count for your documentation.

This is how easily you can configure BetterDocs analytics and measure the performance of your knowledge base site visitors.
If you face any difficulties, feel free to contact our support team.


