BetterDocs For Shopify lets you configure analytics to track the performance of your knowledge base. You can quickly check how many users have read, reacted to, and even discover which search keywords are used most for your documentation using its ‘Analytics‘ tool. It has a graphical interface that allows you to view the comments you’ve received in a statistical manner.
How To Configure Analytics With BetterDocs? #
Follow the step-by-step guide below to learn how to configure analytics to your knowledge base with just a few steps.
Note: You must have BetterDocs for Shopify installed on your store.
Step 1: Go To Analytics Tab #
From the Shopify homepage, go to the analytics tab. After clicking on the ‘Analytics’ tab, you will get all the available options to track the performance of your documentation properly.
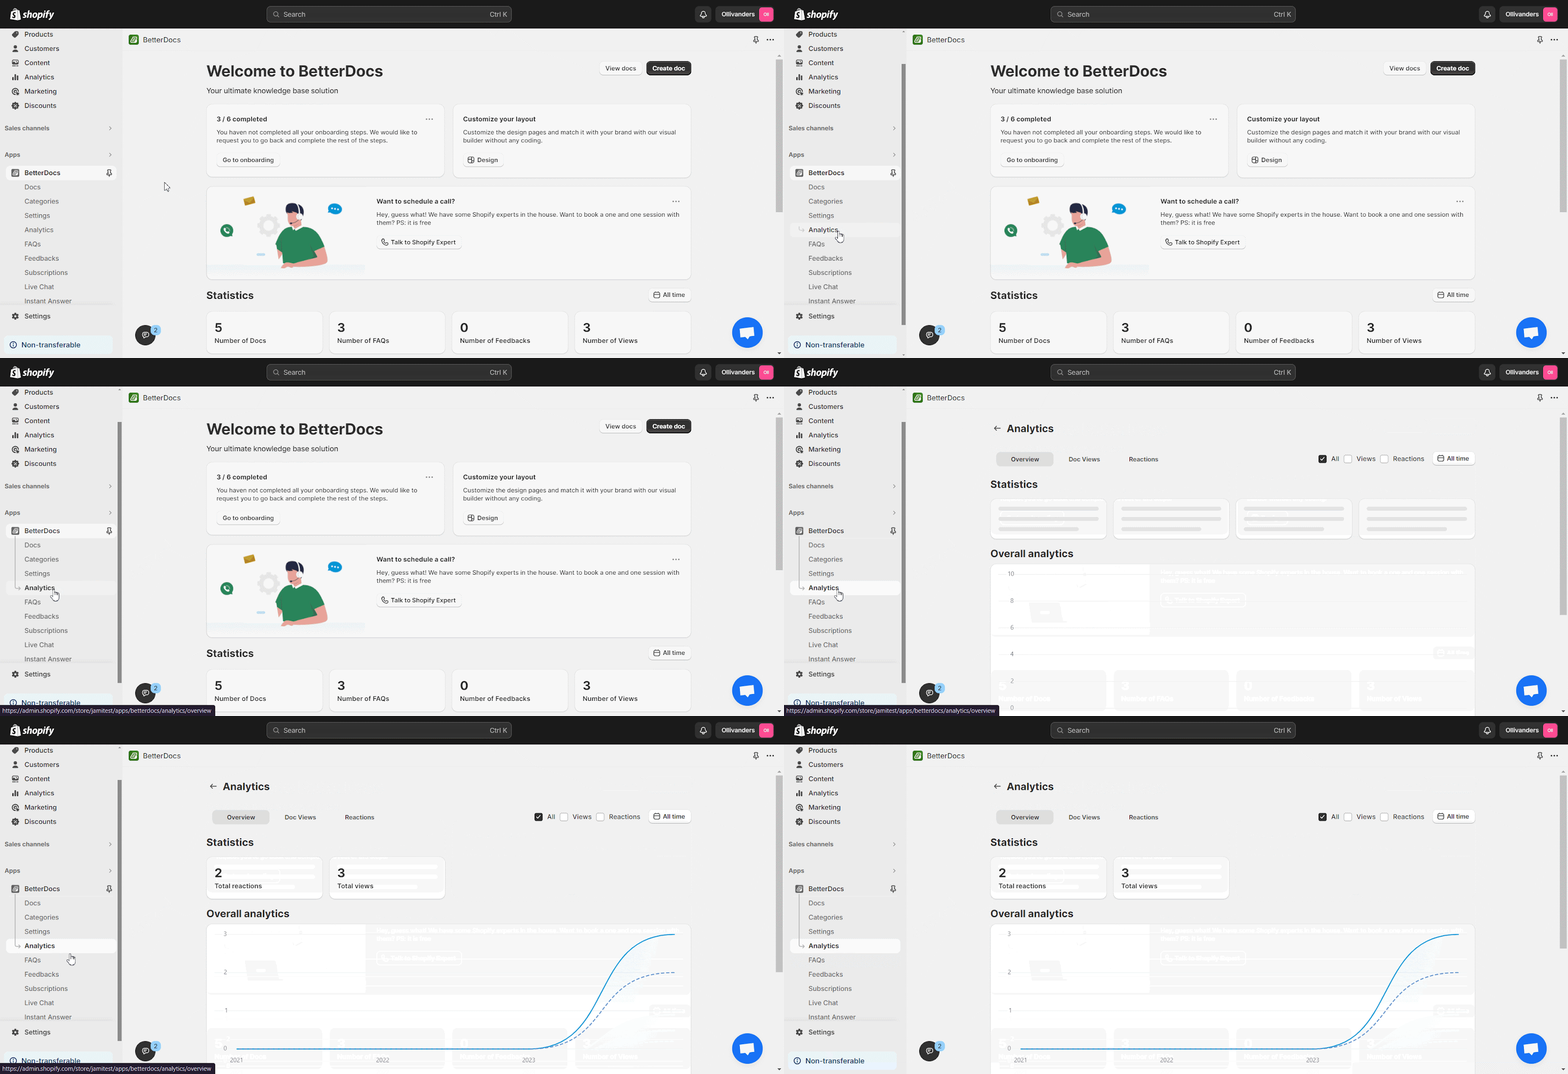
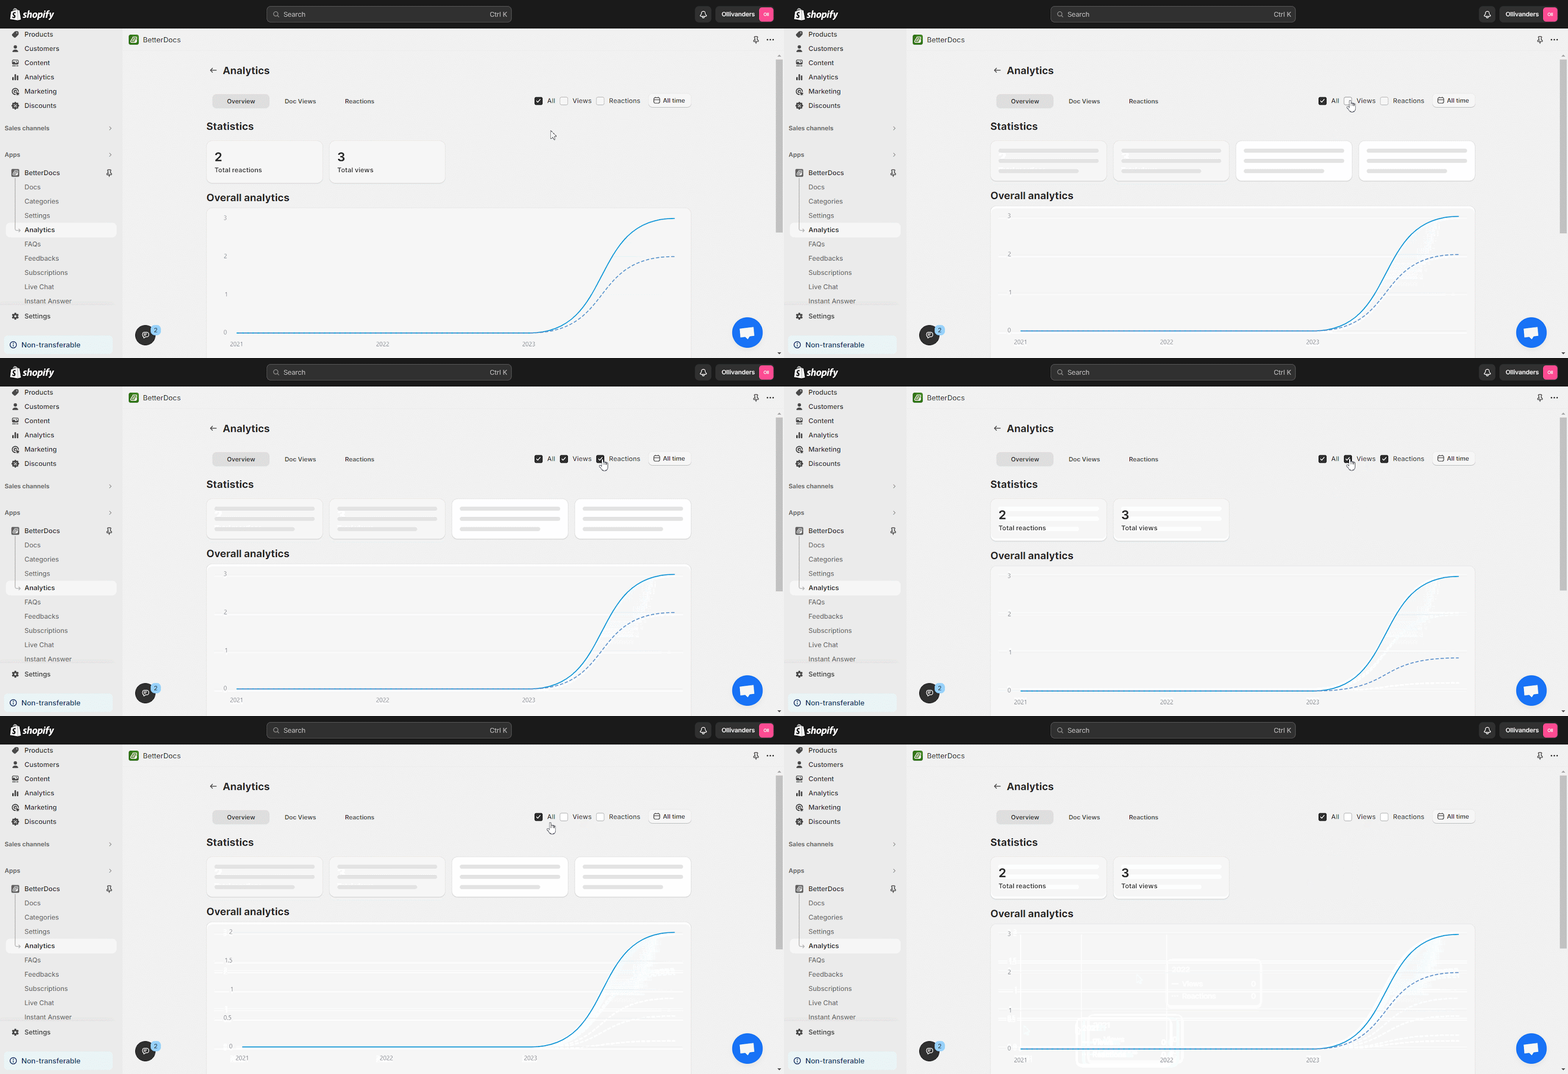
On this page, you can filter your graph based on three options. If you want to see the overall view, check the ‘All’ box, and if you want to see the details of ‘Views’ and ‘Reactions’ simply tick their respective fields.
Step 2: Check The Overview Of Your Analytics #
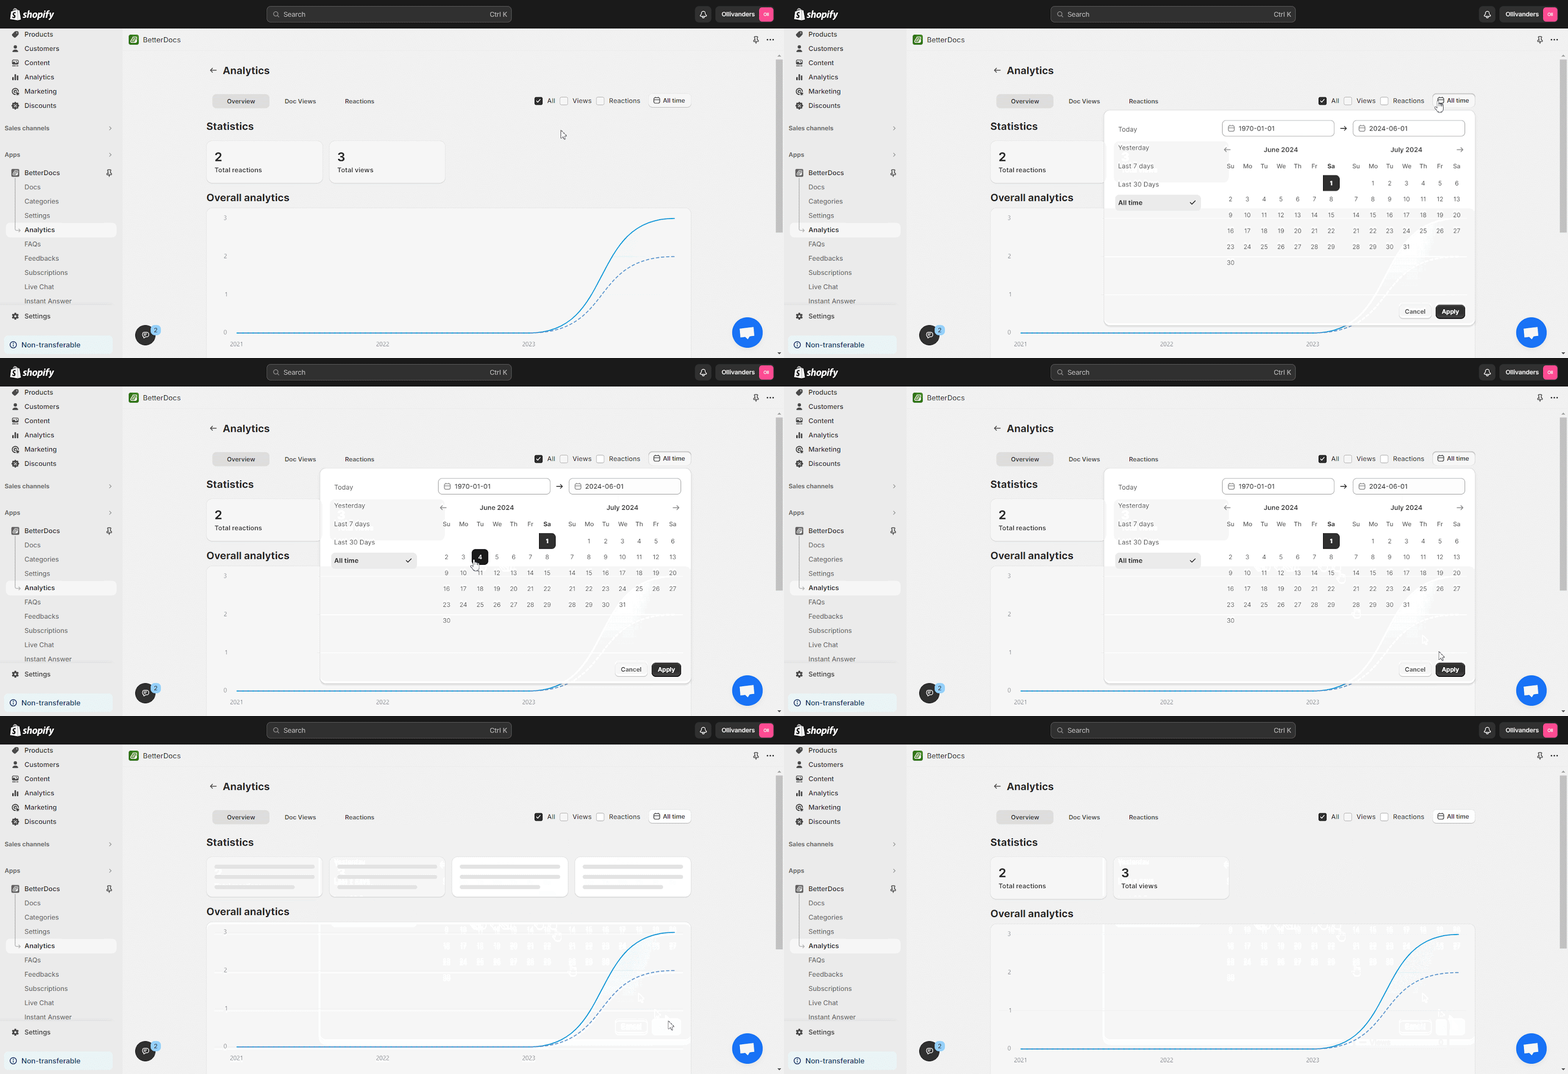
Now select the ‘Overview’ Tab to get the entire performance graph. Here you can filter your results based on any date you want. Click the calendar icon and set your preferred date.
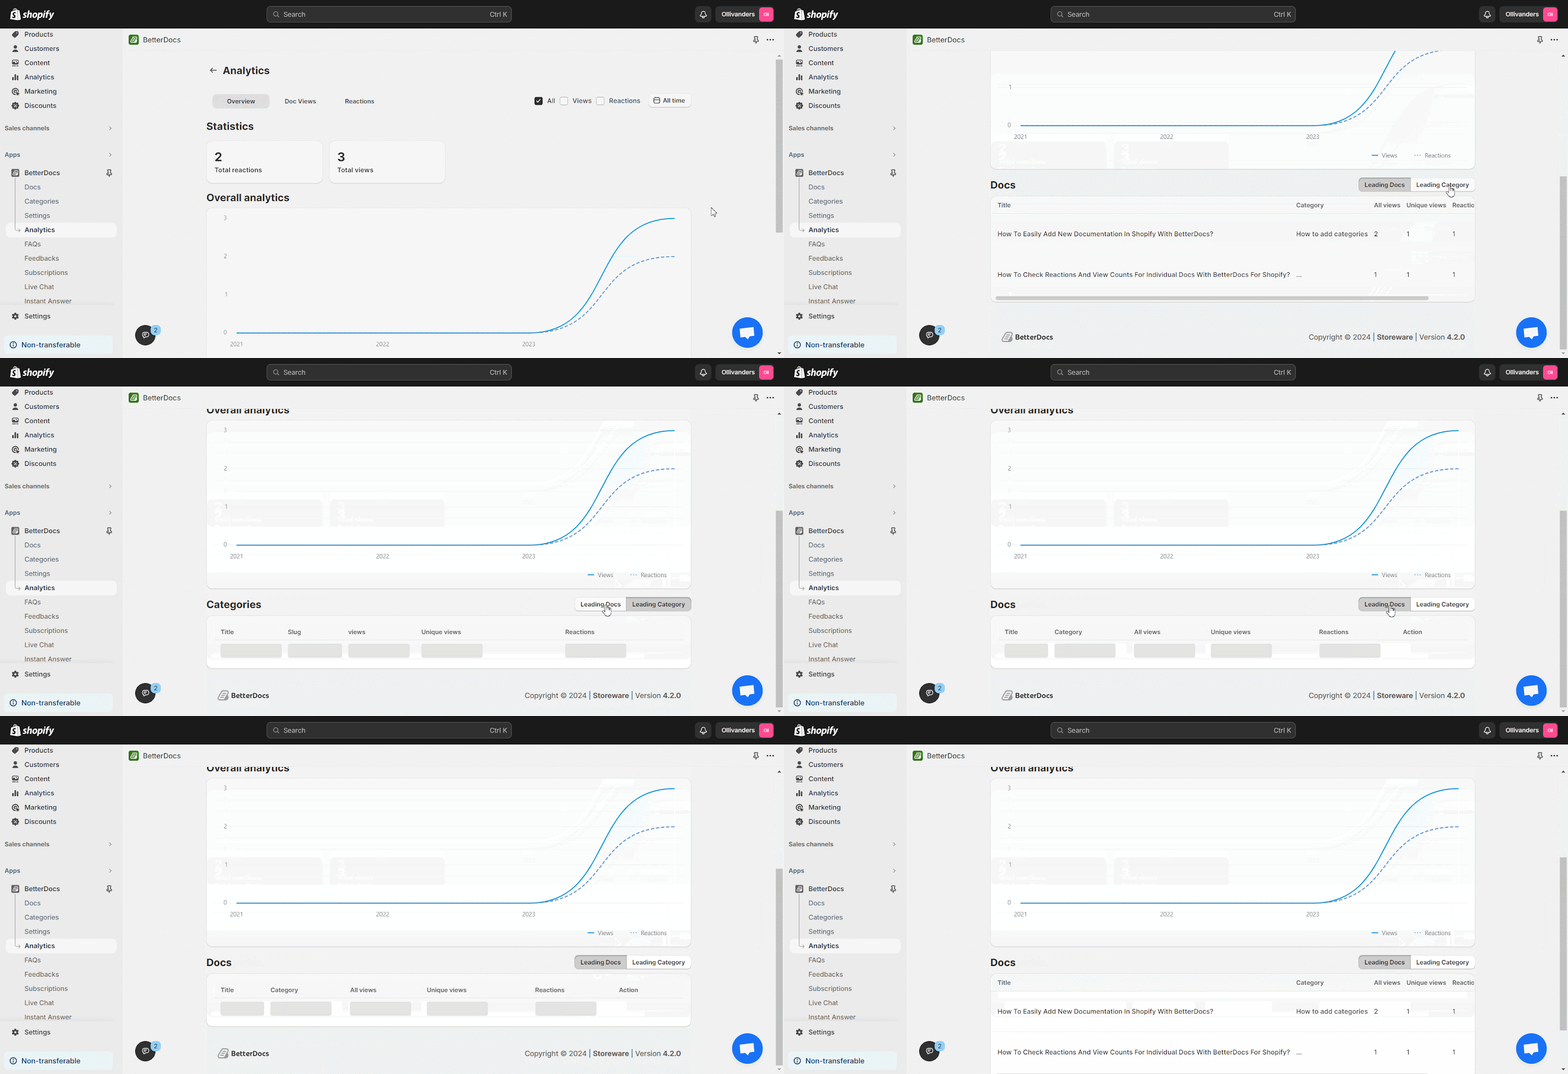
You can also check the list of your well-performed list of ‘Leading Docs’ and ‘Leading Categories’. All your documentation will be properly categorized based on reactions, views, and categories.
Step 3: Track Total Views On Your Docs #
To properly monitor your total views, click on the ‘Doc Views’ option. You can filter the ‘All’ views, ‘Total’ views, and ‘Unique’ views. Set any date you want to view the doc performance.
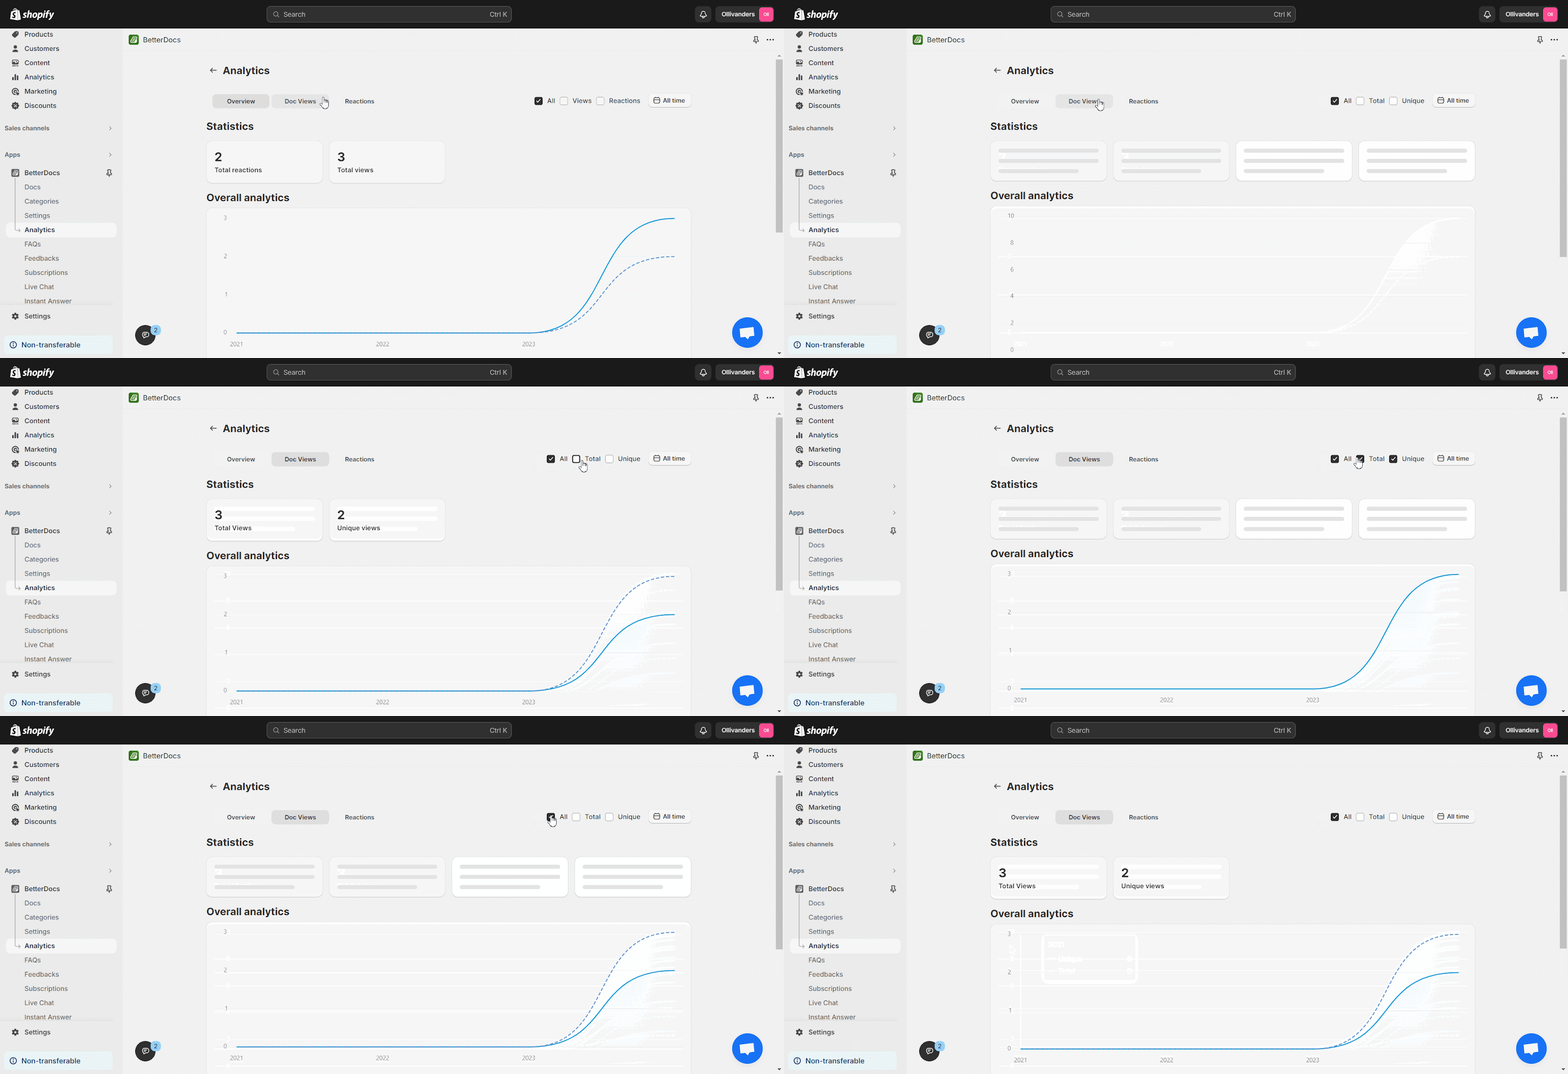
Check your well-performed docs and categories based on their views and reactions. This will help you to improve the lesser-performed documentation.

Step 4: Check The Reaction Analytics #
If you want detailed information about your customer interactions, head over to the ‘Reactions’ tab. Then you will get the graph representation of your BetterDocs documentation. You can filter your data on the basis of ‘Happy’, ‘Neutral’ & ‘Sad’.
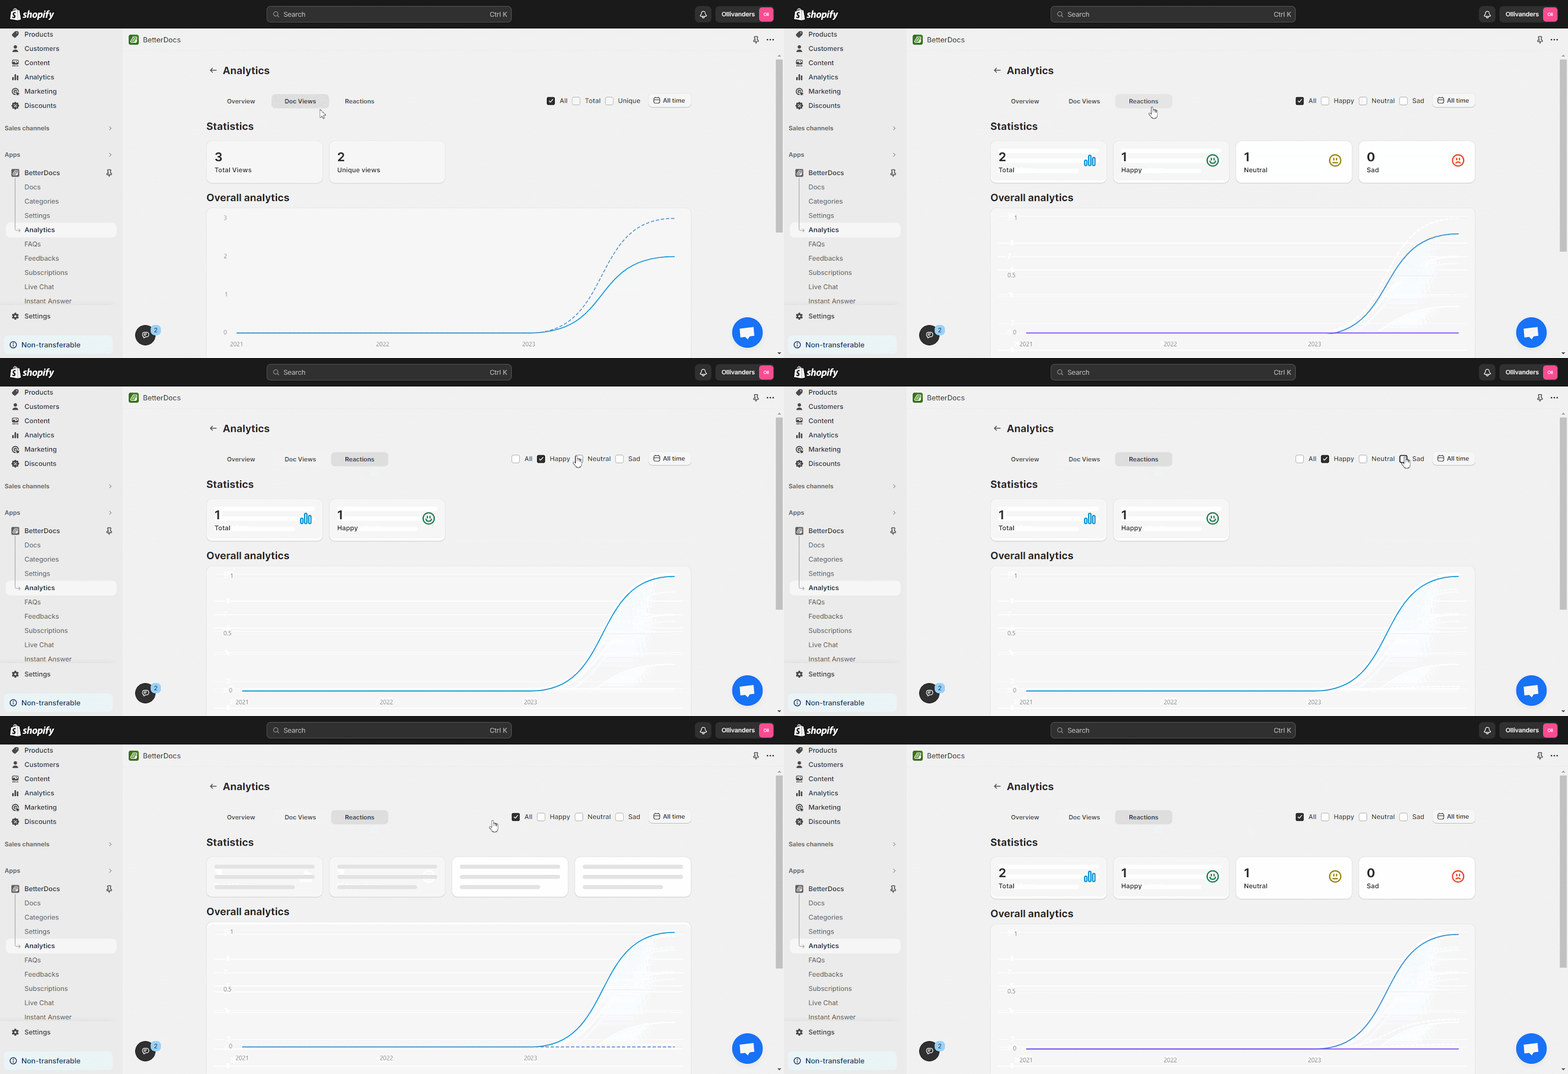
Scroll down to find which documents have helped your customer the most. They will be included under the ‘Most Helpful‘ tab. This field also displays the total number of responses from your readers.
The least popular documents will be listed under the ‘Least Helpful‘ category. This area will assist you in improving the content of your website.
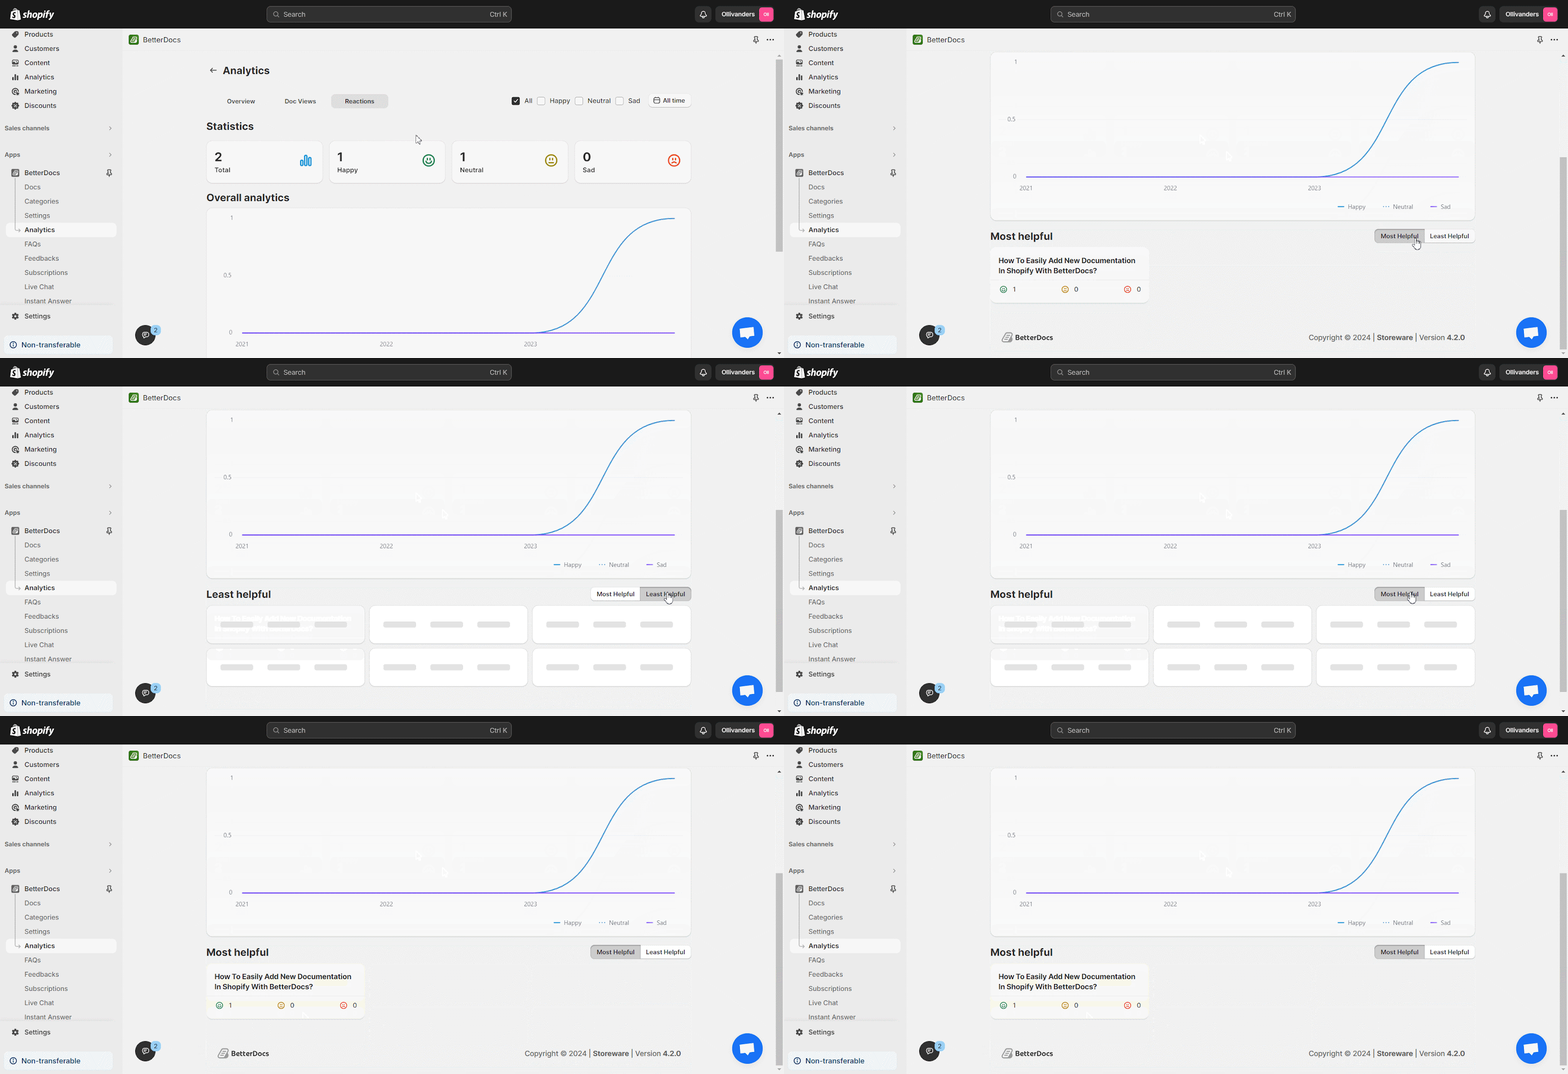
This is how simple it is to set up and configure analytics with the BetterDocs For Shopify app and track the performance of your knowledge base site visitors.
Still, facing difficulties? Feel free to contact our dedicated support team.


